empty
 
 
06.12.2022 11:05 AM
Technical Analysis of EUR/USD for December 6, 2022

Technical Market Outlook:

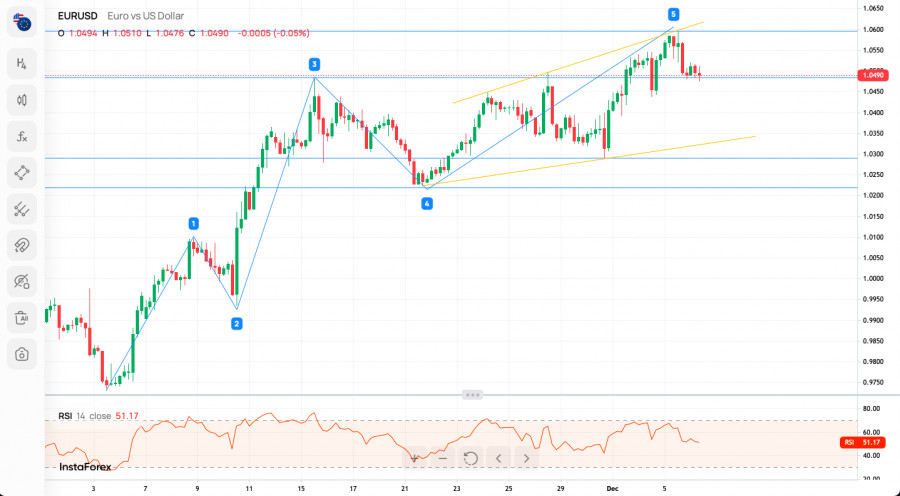
The EUR/USD pair new swing high was made at the level of 1.595, so the market is not that far away from the projected target located at 161% Fibonacci extension at 1.0623. The intraday technical support is located at 1.0481 and 1.0497 and the bulls are testing the support on the H4 time frame chart. The strong and positive momentum supports the short term bullish outlook for EUR on the H4 time frame chart. The bulls still need to complete the wave v of the wave A to the upside as a part of the ABC-X-ABC complex corrective structure.

This image is no longer relevant

Weekly Pivot Points:

WR3 - 1.06535

WR2 - 1.06078

WR1 - 1.05855

Weekly Pivot - 1.05621

WS1 - 1.05398

WS2 - 1.05164

WS3 - 1.04707

Trading Outlook:

The EUR had made a new multi-decade low at the level of 0.9538, so as long as the USD is being bought all across the board, the down trend will continue towards the new lows. In the mid-term, the key technical resistance level is located at 1.0389 and only if this level is clearly violated, the down trend might be considered terminated. Please notice, there is plenty of room to the downside for the EUR to go, all of the potential technical support level are very old and might not be much reliable anymore.

Please be aware, that any sustained breakout below the technical support seen at 0.9737 will extend the down move even more and will put the level of 0.9669 in view. In the longer term, the key technical resistance level is located at 1.0789 (swing high from May 30th), so the bulls still have a long road to take before the down trend reversal is confirmed. It looks like the simple corrective ABC cycle might evolve into more complex and time consuming ABC-X-ABC cycle.

EURUSD
Euro vs US Dollar
Select timeframe
5
min
15
min
30
min
1
hour
4
hours
1
day
1
week
Start trade
Start trade
  • Grand Choice
    Contest by
    InstaForex
    InstaForex always strives to help you
    fulfill your biggest dreams.
    JOIN CONTEST
  • Chancy Deposit
    Deposit your account with $3,000 and get $8000 more!
    In March we raffle $8000 within the Chancy Deposit campaign!
    Get a chance to win by depositing $3,000 to a trading account. Having fulfilled this condition, you become a campaign participant.
    JOIN CONTEST
  • Trade Wise, Win Device
    Top up your account with at least $500, sign up for the contest, and get a chance to win mobile devices.
    JOIN CONTEST
  • 100% Bonus
    Your unique opportunity to get a 100% bonus on your deposit
    GET BONUS
  • 55% Bonus
    Apply for a 55% bonus on your every deposit
    GET BONUS
  • 30% Bonus
    Receive a 30% bonus every time you top up your account
    GET BONUS

Recommended Stories

Analysis of Gold for March 21,.2023 - Potential for the upside continuation

Technical analysis: Gold has been trading in the sideways range at the price of $1.975 but in the upside trending condiiton, which is a sign for potential upside continuation

Petar Jacimovic 08:28 2023-03-21 UTC+2

GBPUSD, H4 | Potential Bearish Reversal from key resistance?

The momentum of the GBP/USD chart is bearish, indicating a possible drop from the 1st resistance level towards the 1st support level. The 1st support level at 1.2194

Dean Leo 07:55 2023-03-21 UTC+2

USDJPY | PBullish Reversal?

Bullish momentum is currently observed on the USD/JPY chart, with the potential for price to rebound from the 1st support level and make its way towards the 1st resistance level

Dean Leo 07:54 2023-03-21 UTC+2

Forecast for EUR/USD on March 21, 2023

Yesterday, the euro was up 53 points, having overcome not only the balance indicator line on the daily chart, but it had also gotten through the collapse of the eurozone

Laurie Bailey 03:58 2023-03-21 UTC+2

Forecast for GBP/USD on March 21, 2023

The British pound gained 96 pips yesterday, reaching and stopping at the MACD daily line. If investors focus on tomorrow's Federal Reserve meeting, at which the rate is expected

Laurie Bailey 03:58 2023-03-21 UTC+2

Forecast or AUD/USD on March 21, 2023

The Australian dollar found the resistance level of 0.6730 very strong - yesterday, a doji candle was formed, and in today's Asian session, it is gradually falling. The signal line

Laurie Bailey 03:58 2023-03-21 UTC+2

March 20, 2023 : EUR/USD daily technical review and trading opportunities.

The market has remained under buying pressure until a plateau level occurred around 1.0800-1.0850. This was followed by a significant SELLING price action leading to the recent price decline

Mohamed Samy 18:51 2023-03-20 UTC+2

March 20, 2023 : EUR/USD Intraday technical analysis and trading plan.

Price action around the key-level of (1.0550-1.0600) was quite bullish. That's why, further bullish continuation towards 1.0800 was demonstrated. Moreover, more bullish advancement towards the nearest supply zone around 1.1150-1.1200

Mohamed Samy 18:50 2023-03-20 UTC+2

March 20, 2023 : GBP/USD Intraday technical analysis and significant key-levels.

The GBPUSD bulls failed to record a new high above 1.2200. Instead, a descending high was established around the same price level. On the other hand, the current bearish pullback

Mohamed Samy 18:49 2023-03-20 UTC+2

Increased chances for upward reversal in USDJPY.

USDJPY is trading around 131.60. Short-term trend remains bearish. Price continues making lower lows and lower highs. Price is still inside the downward sloping red channel. As long as this

Alexandros Yfantis 17:01 2023-03-20 UTC+2
Can't speak right now?
Ask your question in the chat.