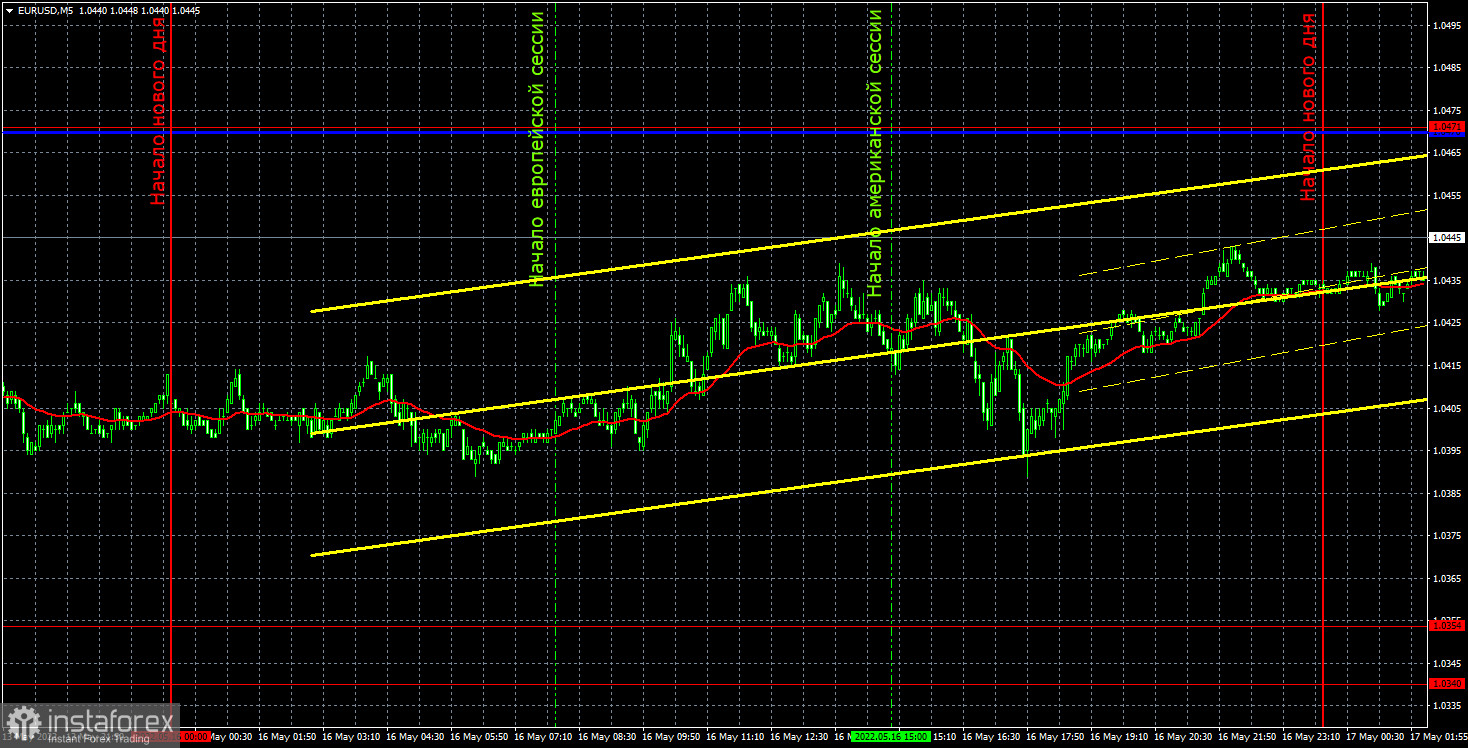
EUR/USD 5M
The EUR/USD pair continued its upward correction with grief in half on Monday. This upward correction, to be honest, does not even look like a correction yet, since it is several times weaker than the downward movement that preceded it. Thus, it would be better to say "rollback". In general, the pair continues to maintain a downward trend and the euro could fall almost at any moment. Unfortunately, the market not only does not pay attention to the fact that it is necessary to correct from time to time, it even ignores the macroeconomic statistics that could support the euro. So it all comes down to simple long positions on the dollar in any situation now. From time to time, the pair takes a break, during which it mostly moves sideways. There were no macroeconomic statistics and fundamental events on Monday. Volatility was rather weak, which is not surprising.
The situation was even more boring in terms of trading signals, since none were formed on Monday. The pair did not even come close to any level or line. In fairness, it should be noted that there are practically no levels in the current price range, and the Ichimoku indicator lines are located above the current price values. This happens because the downward trend is too strong and the Kijun-sen and Senkou Span B lines seem to be catching up with the price. And they do it with a noticeable delay. There are so few levels because the pair is near its 20-year lows.
COT report:
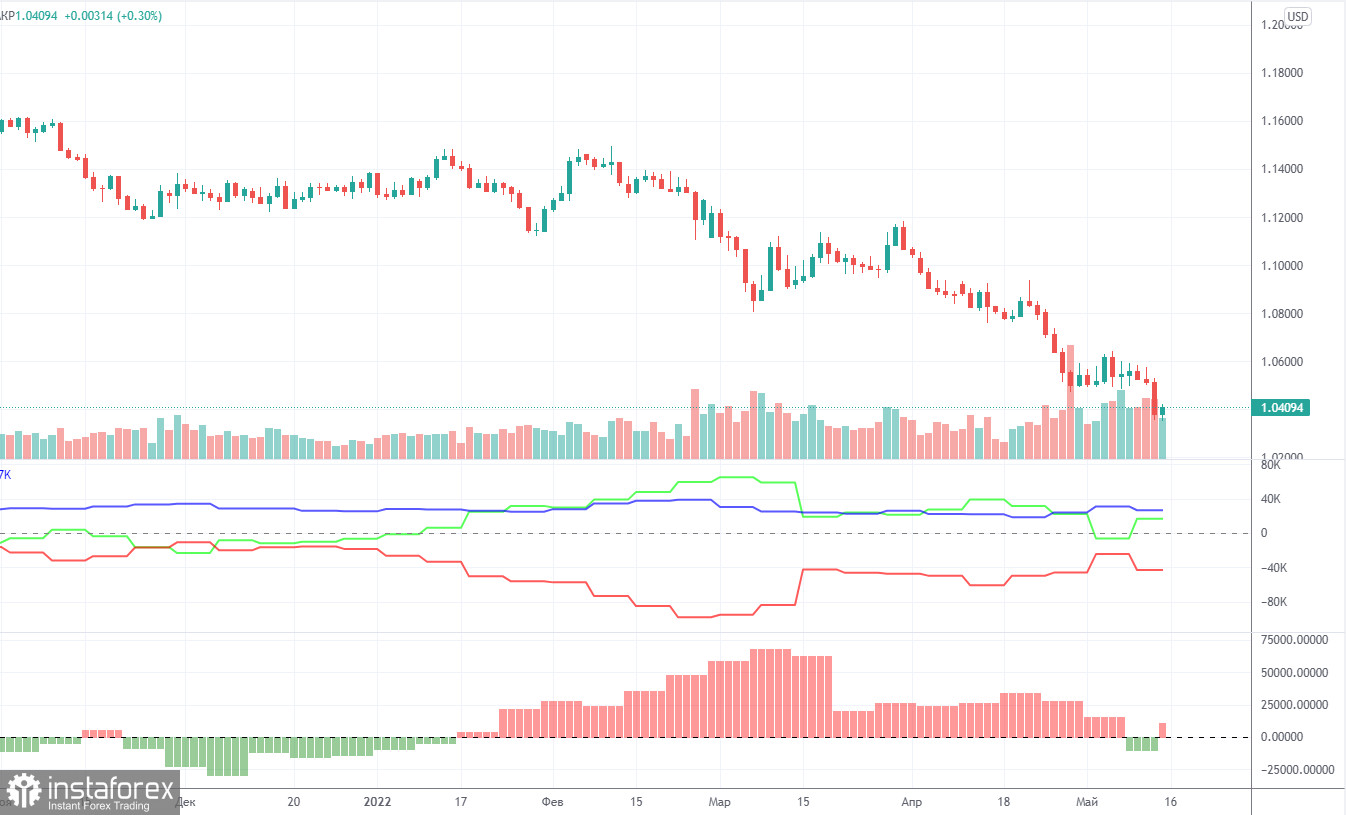
The latest Commitment of Traders (COT) reports on the euro raised more questions than they answered! The week before last, for the first time in a long time, the COT report showed a bearish mood among traders, which is logical, given the strong fall of the euro in recent months. However, the new COT report again showed an increase in bullish sentiment! During the reporting week, the number of long positions increased by 19,800, while the number of short positions in the non-commercial group decreased by 3,100. Thus, the net position grew by 23,000 positions per week. This means that the bearish mood has turned to bullish, as the number of longs now exceeds the number of shorts for non-commercial traders by 17,000. As a result, we again have a paradoxical picture in which big players buy more euros than they sell, but at the same time, the euro falls. From our point of view, this is because the demand for the US dollar is much higher than the demand for the euro. Even if someone suggested that the whole point is the weakening of the bullish mood in recent months (the second indicator is a histogram), then we recall that in the week between May 4 and 10, commercial traders opened 20,000 longs, and the euro increased by 30 points over the same period... Thus, it is still impossible to make a correlation between COT reports and what is happening in the market. Forecasts to build on such data, moreover, do not make sense.
We recommend to familiarize yourself with:
Overview of the EUR/USD pair. May 17. The Baltic is a new platform for a possible clash between Russia and NATO.
Overview of the GBP/USD pair. May 17. Great Britain and the European Union are obviously bored: a trade war may begin.
Forecast and trading signals for GBP/USD on May 17. Detailed analysis of the movement of the pair and trading transactions.
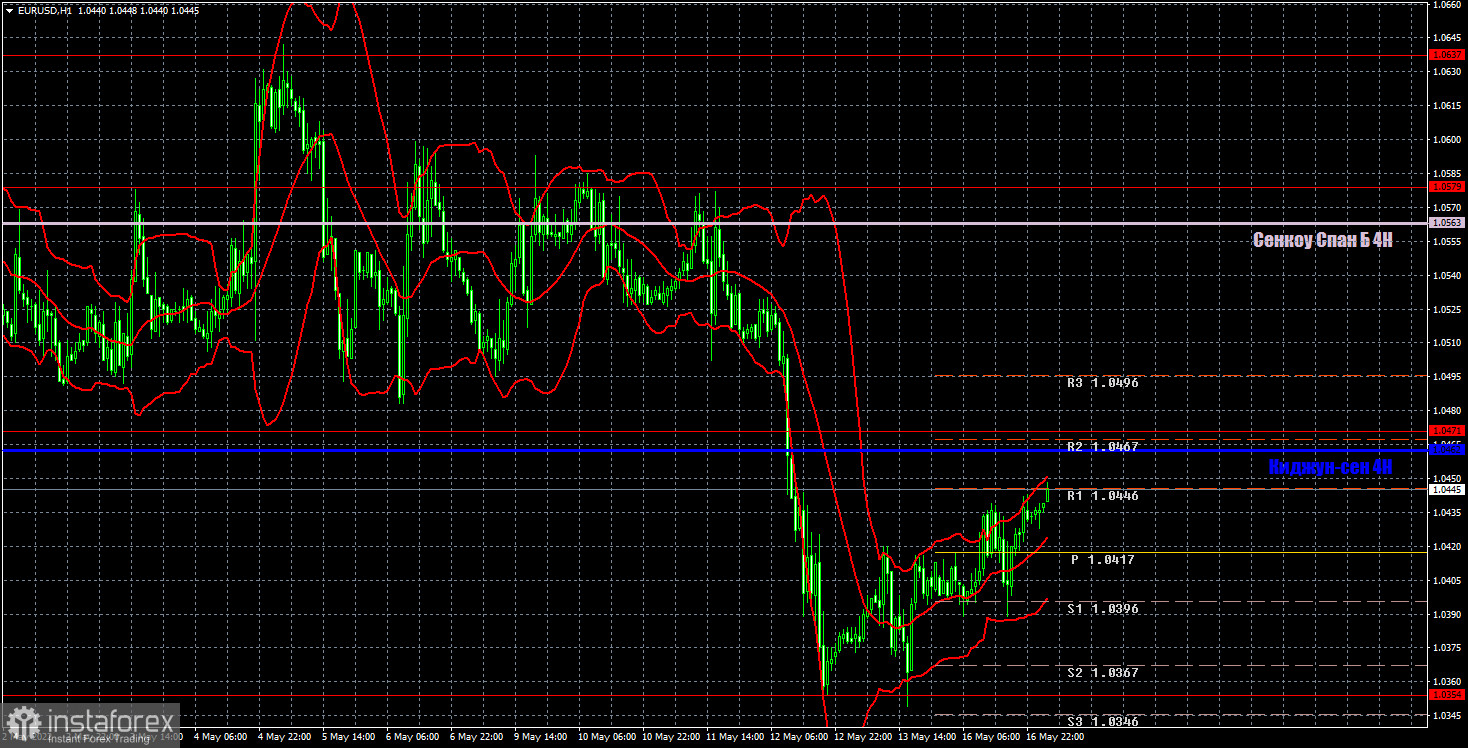
EUR/USD 1H
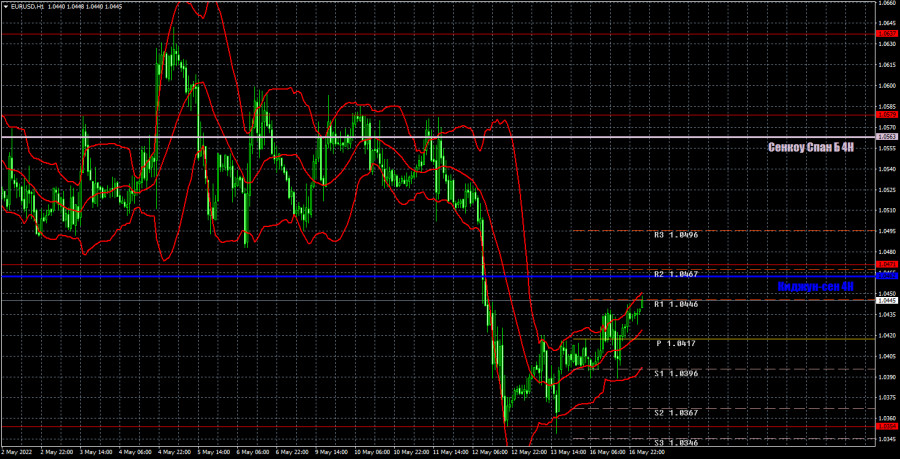
The pair continues its downward trend on the hourly timeframe and now we have a clear support area at 1.0340-1.0354, which represents 20-year lows. It makes no sense to talk about the technical picture now, since it has remained unchanged for a very, very long time. As long as the price is below the critical line, we do not expect the euro to show significant growth against the dollar. On Tuesday, we allocate the following levels for trading - 1.0340-1.0354, 1.0471, 1.0579, as well as Senkou Span B (1.0563) and Kijun-sen (1.0462) lines. Ichimoku indicator lines can move during the day, which should be taken into account when determining trading signals. There are also secondary support and resistance levels, but no signals are formed near them. Signals can be "rebounds" and "breakthrough" extreme levels and lines. Do not forget about placing a Stop Loss order at breakeven if the price has gone in the right direction for 15 points. This will protect you against possible losses if the signal turns out to be false. Several reports of medium importance are scheduled for May 17 in the European Union and the United States. In the EU, we have the GDP for the first quarter in the second estimate, in the US, there's retail sales and industrial production in April. We do not believe that this data, whatever it may be, is capable of provoking a strong market reaction. Volatility may remain not too high, and the movement may be weakly upward.
Explanations for the chart:
Support and Resistance Levels are the levels that serve as targets when buying or selling the pair. You can place Take Profit near these levels.
Kijun-sen and Senkou Span B lines are lines of the Ichimoku indicator transferred to the hourly timeframe from the 4-hour one.
Support and resistance areas are areas from which the price has repeatedly rebounded off.
Yellow lines are trend lines, trend channels and any other technical patterns.
Indicator 1 on the COT charts is the size of the net position of each category of traders.
Indicator 2 on the COT charts is the size of the net position for the non-commercial group.