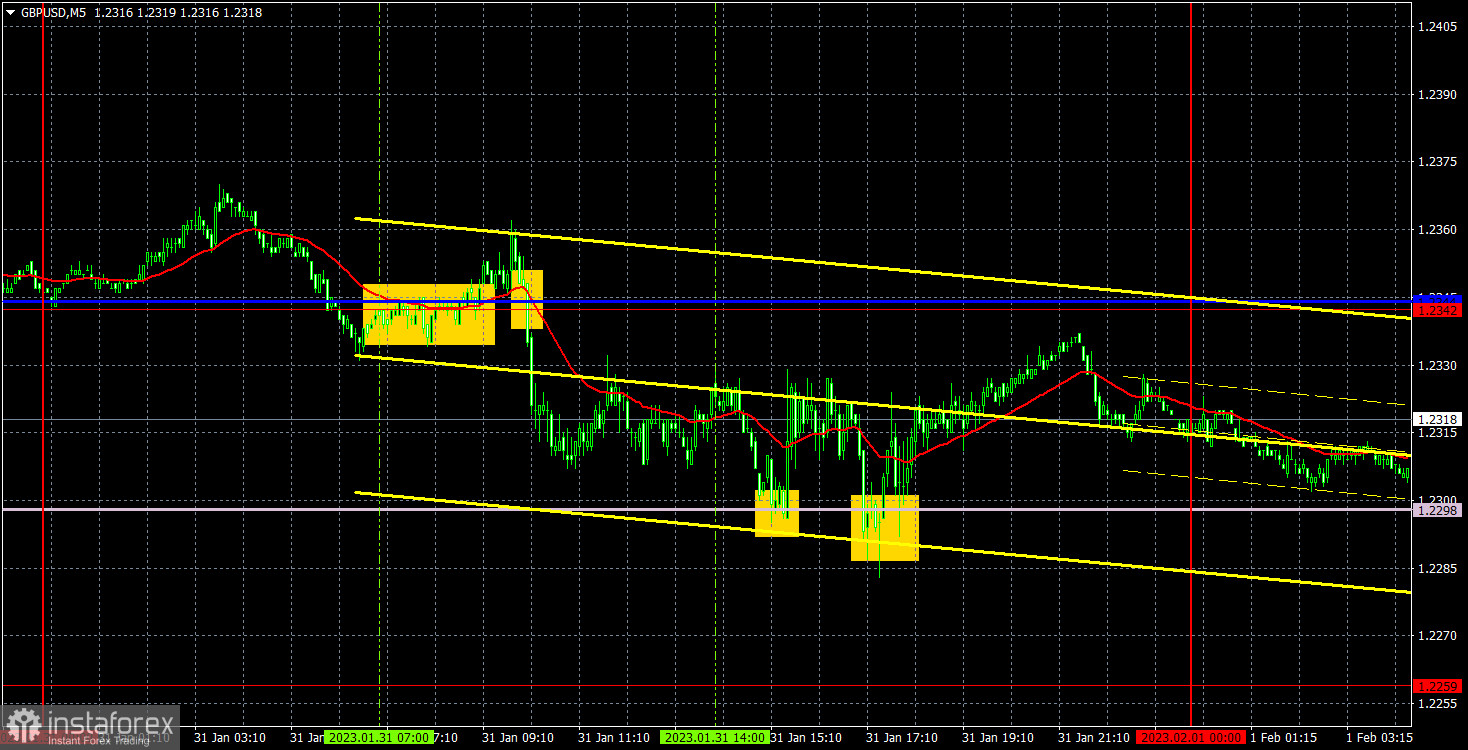
M5 chart of GBP/USD
GBP/USD continues to move within the sideways channel, which is not surprising, since the pound was mostly flat for about three weeks. We will finally receive important reports starting today, so we can hope for a trendy, volatile movement. At the moment, the pair reached the lower limit of the channel, so according to the technique, it may bounce from it and start a new round of upward movement. If today's reports are not in favor of the USD, the pound may surge, which will occur within the same sideways channel. Yesterday, the pair could not cross the Senkou Span B line twice, so there are not many technical reasons to expect the continuation of the decline.
Yesterday, there were four trade signals. The pair initially settled above the critical line, and frankly, this signal was false. The price could not even pass 20 points in the right direction. Then it settled below the Kijun-Sen line, afterwards the pair descended to the Senkou Span B. You could earn about 25 pips on this deal, which covered the loss from the first trade. Two rebounds from the Senkou Span B could be worked out using long positions. In the first case, the deal was closed with Stop Loss at breakeven, in the second case, traders could earn about 15-20 points of profit, and the deal should have been closed manually closer to the evening. Not a bad result, given the flat.
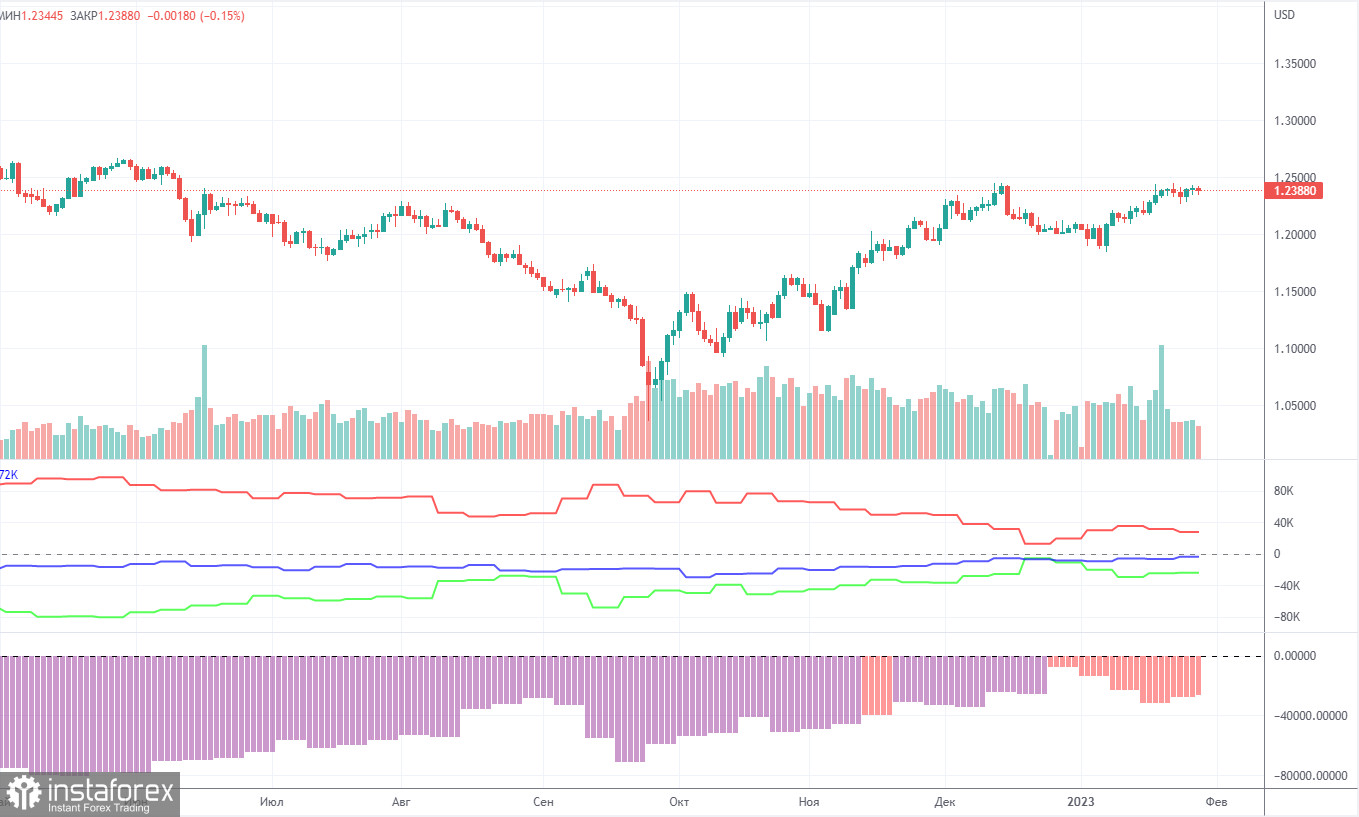
COT report
The latest COT report showed a decrease in bearish sentiment. In a week, non-commercial traders closed 6,700 long positions and 7,500 short positions. The net non-commercial position grew by 800. The net non-commercial position has been on the rise in recent months. The sentiment of large traders may soon turn bullish. Although the pound sterling has been bullish against the greenback in recent months, its growth can hardly be explained with the help of fundamental analysis. We should not rule out the possibility that the pound may fall against the dollar in the medium term as a correction is needed. Overall, the latest COT reports have been in line with the pair's movement. Since the net position is not bullish yet, the buying spree may go on for several months more. Non-commercial traders now hold 35,000 long positions and 59,000 short ones. We are still skeptical about the pair being bullish in the long term although there are technical reasons for that. However, in terms of fundamentals and geopolitics, this will unlikely be a strong and fast uptrend.
H1 chart of GBP/USD
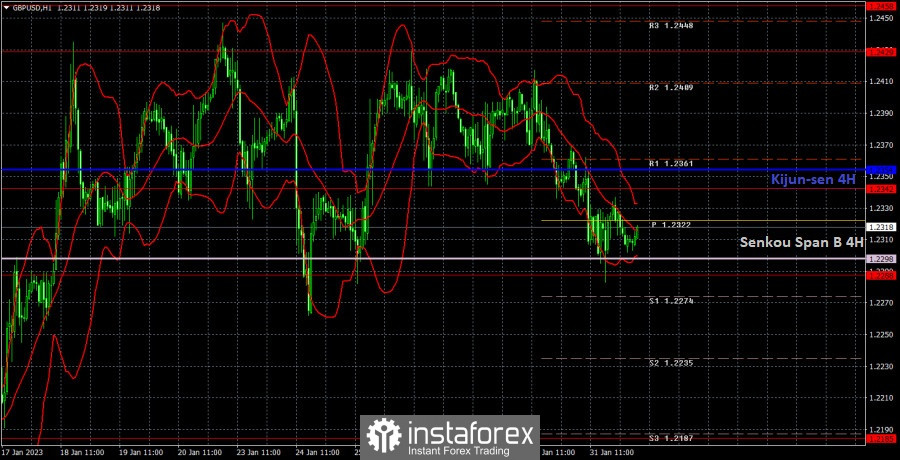
On the one-hour chart, GBP/USD is still moving in the sideways channel. You can clearly see this on the charts. Lines of the indicator Ichimoku are not strong now, but we still fixed their last position in order not to form a ton of false signals near them. Now we will wait for the pair to cross both the Ichimoku indicator lines. Otherwise, a new round of growth inside the sideways channel with 1.2429 as the target. On February 1, the pair may trade at the following levels: 1.1974-1.2007, 1.2106, 1.2185, 1.2288, 1.2342, 1.2429-1.2458, 1.2589, 1.2659. The Senkou Span B (1.2298) and Kijun Sen (1.2354) lines may also generate signals. Pullbacks and breakouts through these lines may produce signals as well. A Stop Loss order should be set at the breakeven point after the price passes 20 pips in the right direction. Ichimoku indicator lines may move during the day, which should be taken into account when determining trading signals. In addition, the chart does illustrate support and resistance levels, which could be used to lock in profits. On Wednesday, the UK will only release its manufacturing PMI report, on the other hand, the US will release an important report on the ISM manufacturing index. In the evening, the results of the Federal Reserve meeting will be announced and Fed Chairman Jerome Powell's succeeding press conference.
What we see on the trading charts:
Price levels of support and resistance are thick red lines, near which the movement may end. They do not provide trading signals.
The Kijun-sen and Senkou Span B lines are the lines of the Ichimoku indicator, moved to the one-hour chart from the 4-hour one. They are strong lines.
Extreme levels are thin red lines from which the price bounced earlier. They provide trading signals.
Yellow lines are trend lines, trend channels, and any other technical patterns.
Indicator 1 on the COT charts reflects the net position size of each category of traders.
Indicator 2 on the COT charts reflects the net position size for the non-commercial group.