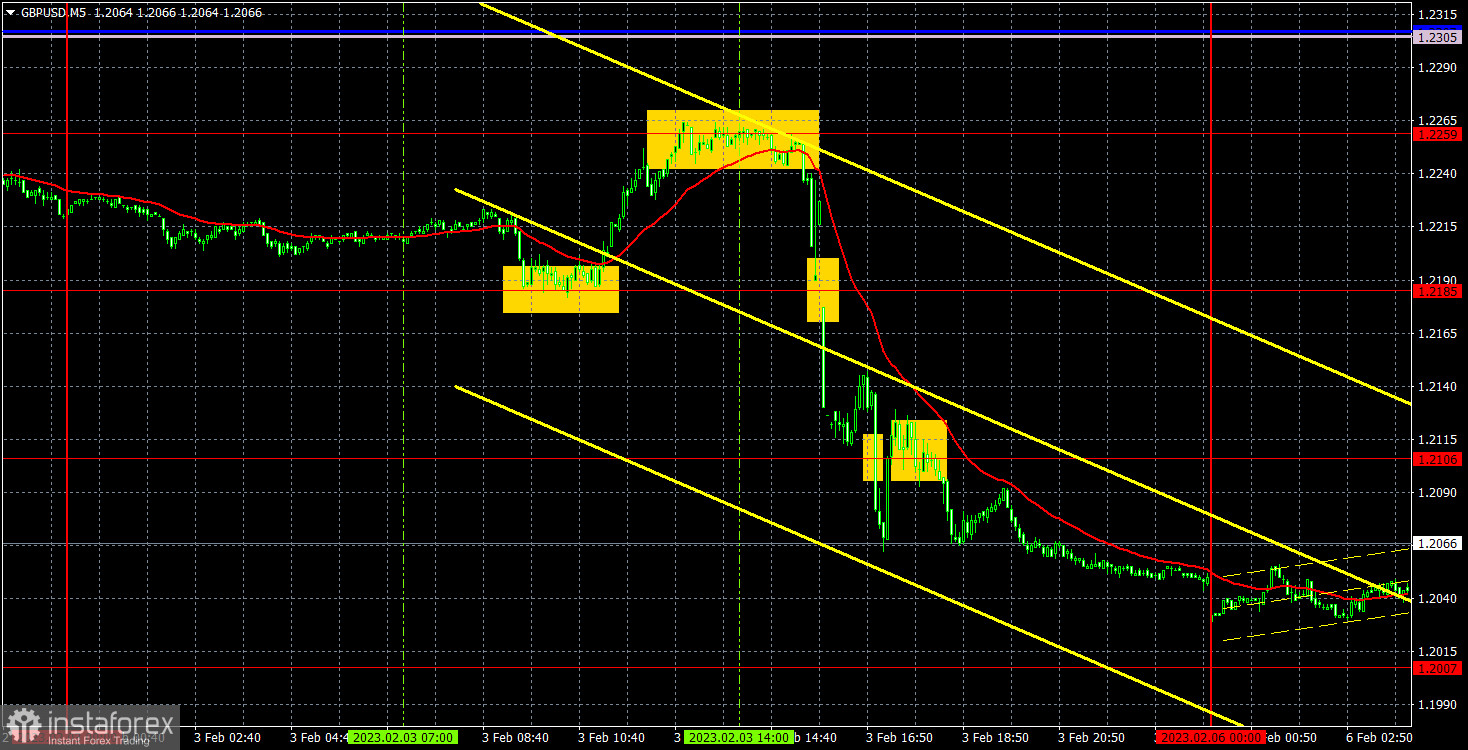
Analysis of GBP/USD, 5-minute chart
On Friday, the pound/dollar pair slumped. However, judging by the fundamental and macroeconomic data received last week, the situation could hardly be the opposite. Notably, the euro and the pound sterling were rising for a long time without obvious reasons. By the moment of central banks' meetings, both currencies were considerably overbought. Hawkish results of the meetings were priced in long ago. That is why the euro and British pound would have fallen in any case. Meanwhile, Friday's reports on the US unemployment rate, non-farm payrolls, and ISM PMI allowed the US dollar to increase. Now, the pound/dollar pair is likely to go on falling. The pound sterling has lost its upward momentum. The fundamental data is expected to worsen since the Bank of England may stop the monetary policy tightening at any moment. The key interest rate is likely to rise at a slower pace like in the US. Thus, there will be no reason for an increase in the British pound. Even if this assumption is false, there should be a downward correction.
On Friday, trading signals were quite good. At first, the pair rebounded from 1.2185 to 1.2259. Then, it bounced off 1.2259 to 1.2106. Using these two signals, traders might have earned about 180 pips. The signals formed later should have been ignored since they appeared too late.
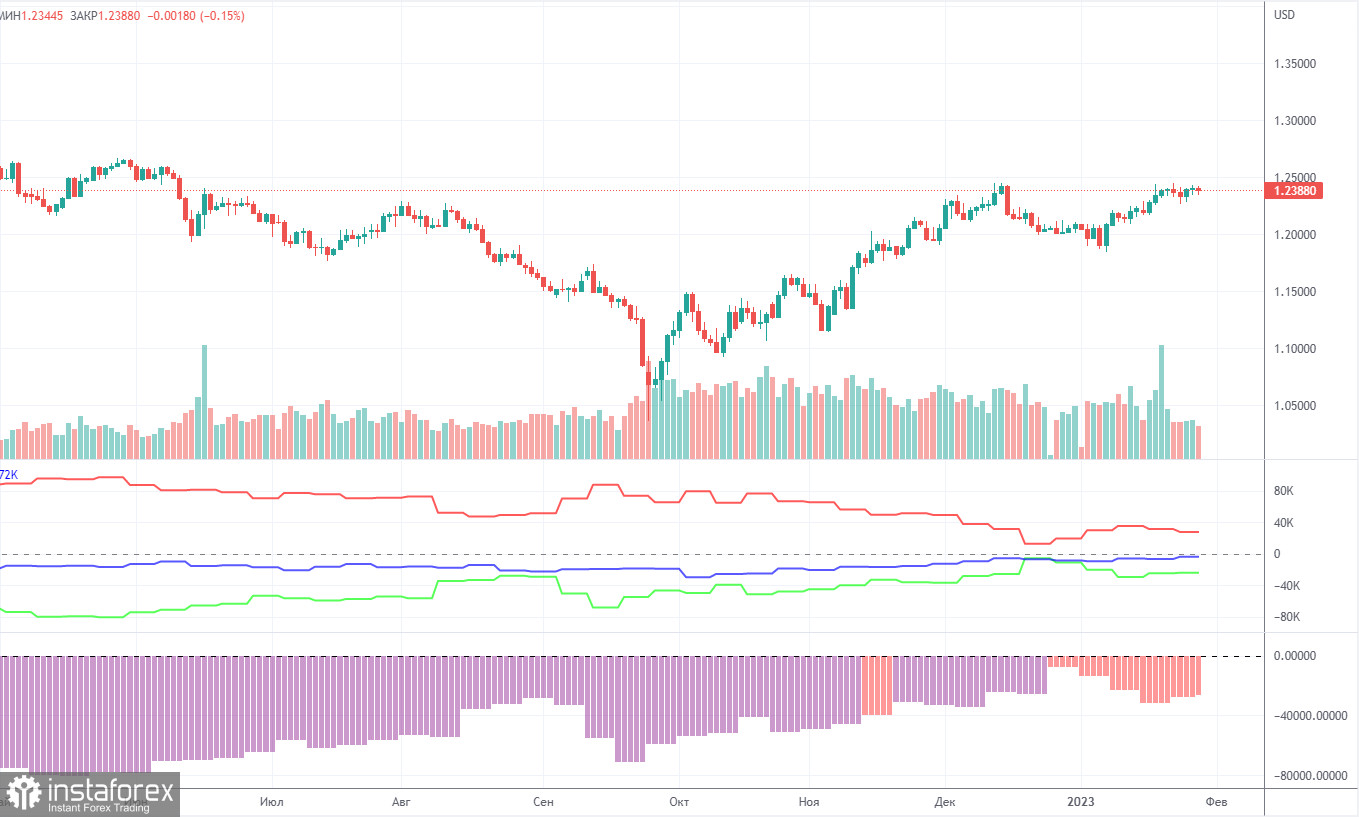
COT report
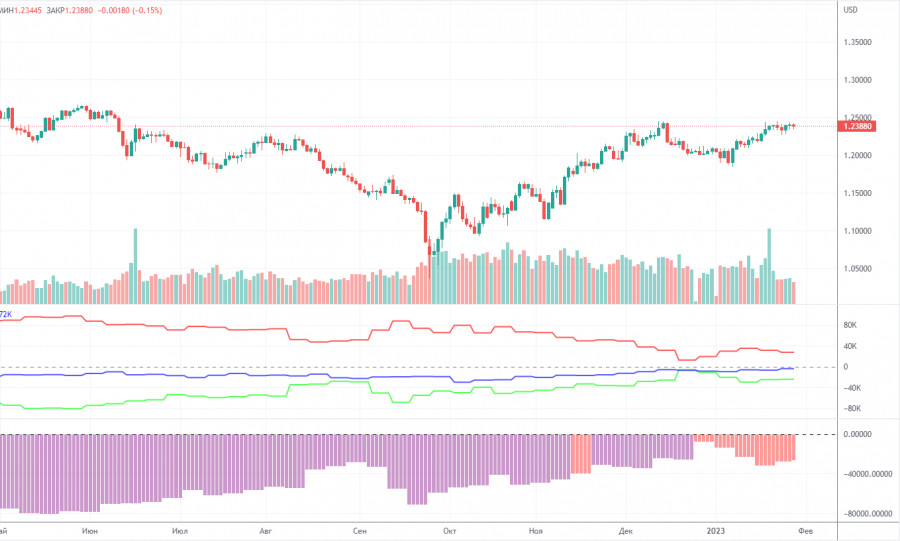
The recent COT report on the pound sterling unveiled that the bearish sentiment became weaker. During the week, non-commercial traders closed 6.7 thousand BUY contracts and 78.5 thousand SELL contracts. Thus, the net position of non-commercial traders increased by 0.8 thousand. During the last few months, the net position was increasing quite stably. The sentiment of big traders could become bullish in the near future. It is still very hard to explain why the pound sterling increased so much against the US dollar. In the mid-term, the British pound could drop as it needs correction. In general, the recent COT reports have been corresponding to the pound's movement. Since the net position is not bullish anymore, traders may buy the asset in the next few months. By the moment, non-commercial traders have opened 35 thousand buy positions and 59 thousand sell positions. We do not expect long-lasting growth in the pound sterling. Although it has technical reasons for that, the fundamental and geopolitical factors do not presuppose a strong and fast increase.
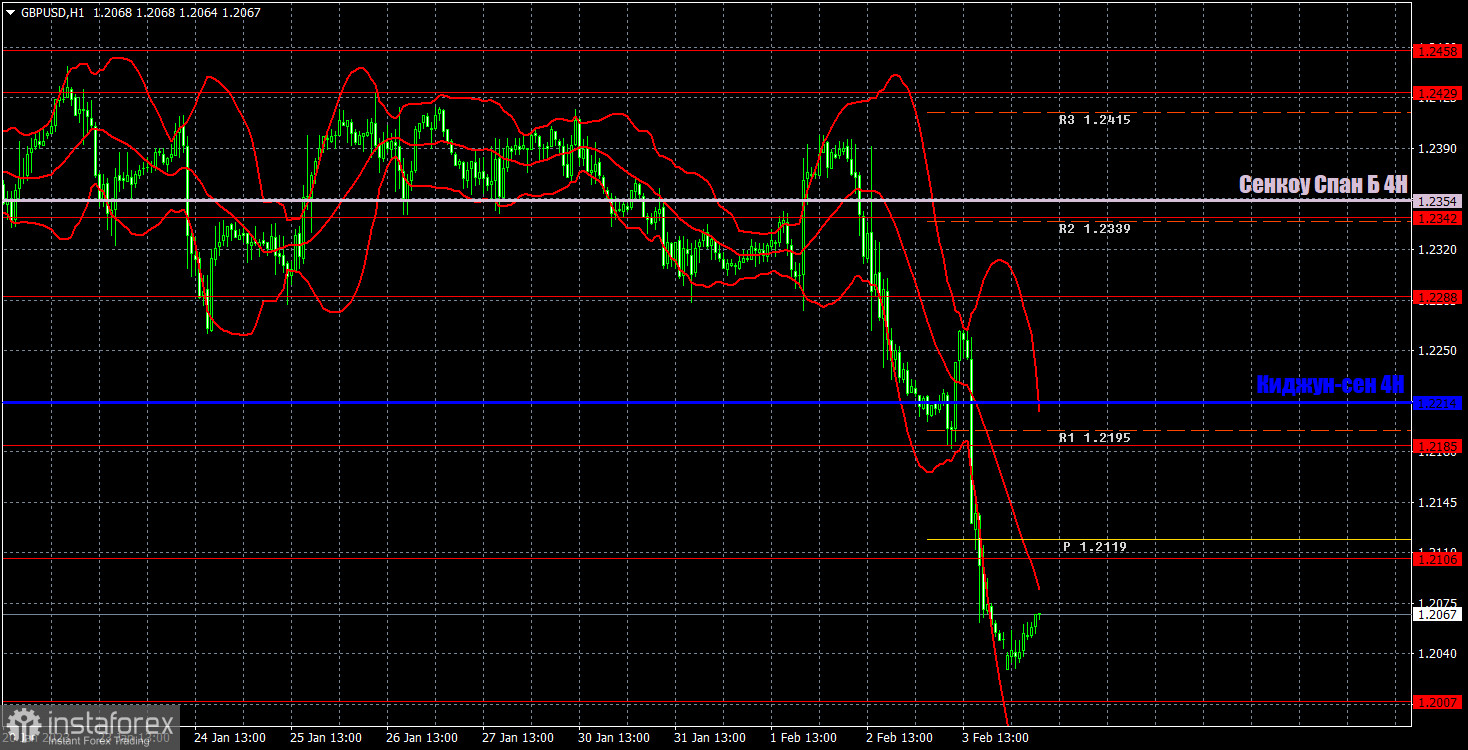
Analysis of GBP/USD, 1-hour chart
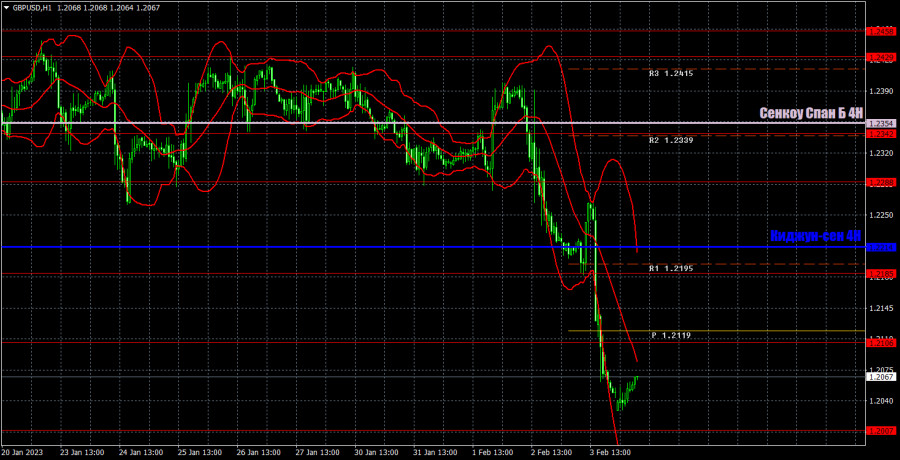
On the hourly chart, the pound/dollar pair left the sideways channel and showed signs of a downward movement in the short term. This week, the pair may climb slightly, whereas the volatility may drop since the fundamental and macroeconomic background will be weak. On February 6, there are the following important levels: 1.1874, 1.1974-1.2007, 1.2106, 1.2185, 1.2288, 1.2342 The Senkou Span B (1.2354) and Kijun-sen (1.2214) lines can also give signals. Rebounds and breakouts of these levels could also act as signals. It is recommended to place the stop loss level at the breakeven when the price covers 20 pips in the right direction. The lines of the Ichimoku indicator could move during the day, which should be taken into account when determining trading signals. There are also support and resistance levels that could be used to fix profits. On Monday, only construction PMI will be published in the UK, and nothing at all in the US. Nevertheless, the pair may show an inertial downward movement today as traders have not priced all the events of the last week. However, the volatility will become lower.
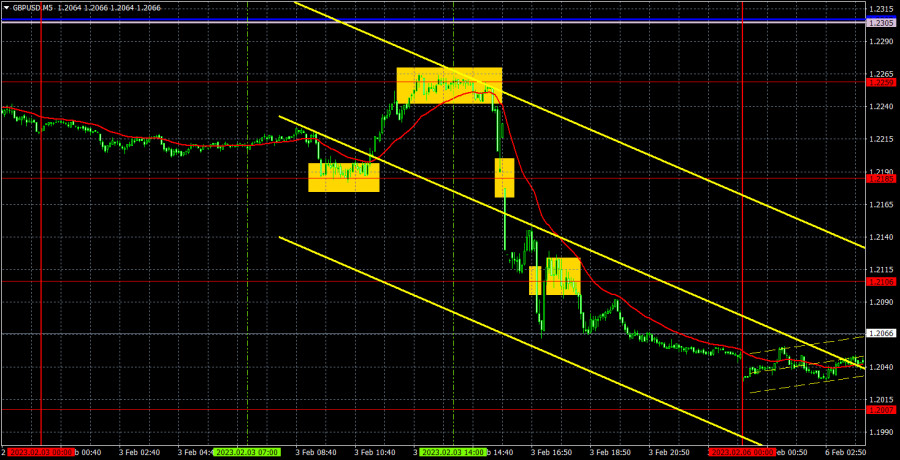
What we see on the trading charts:
Price levels of support and resistance are thick red lines, near which the movement may end. They do not provide trading signals.
The Kijun-sen and Senkou Span B lines are the lines of the Ichimoku indicator, moved to the one-hour chart from the 4-hour one. They are strong lines.
Extreme levels are thin red lines from which the price bounced earlier. They provide trading signals.
Yellow lines are trend lines, trend channels, and any other technical patterns.
Indicator 1 on the COT charts reflects the net position size of each category of traders.
Indicator 2 on the COT charts reflects the net position size for the non-commercial group.