Analyzing Thursday's trades:
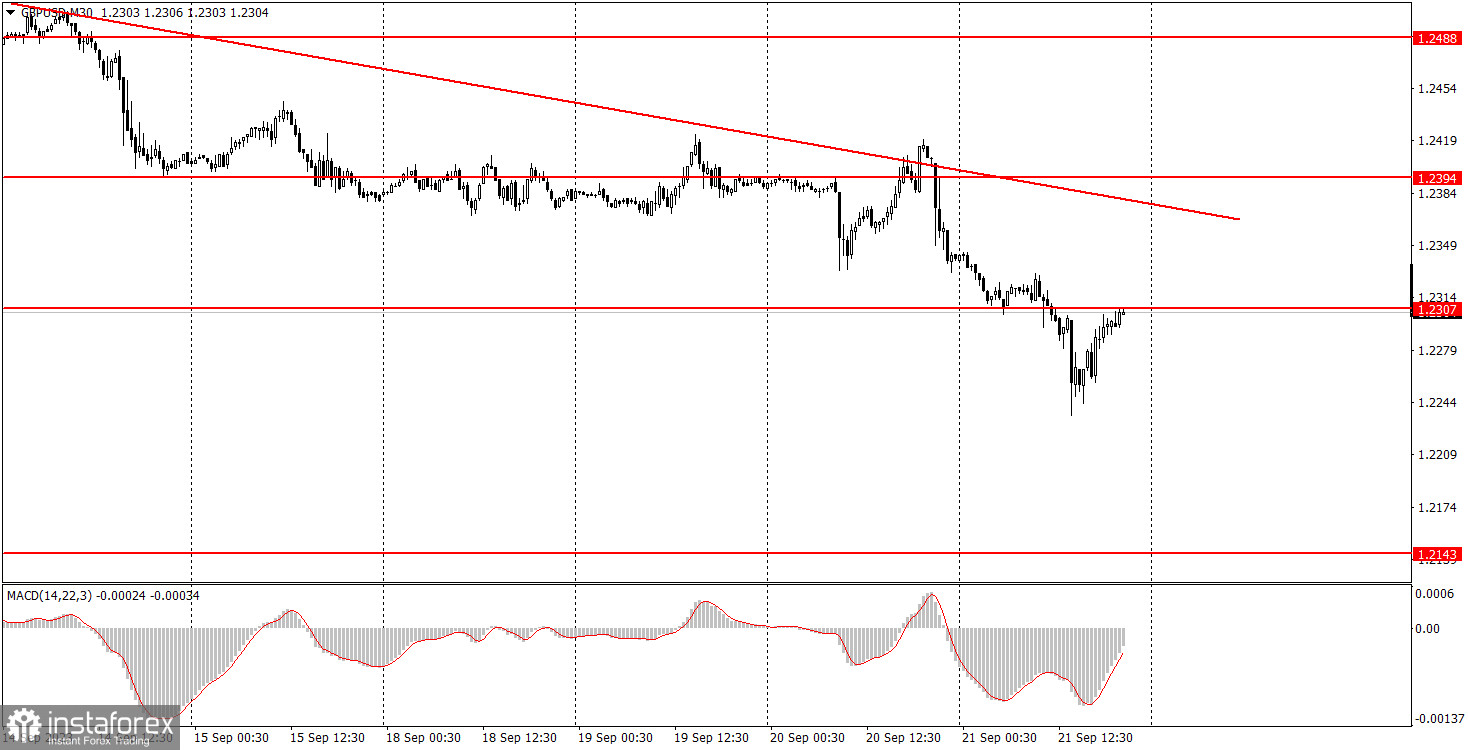
GBP/USD on 30M chart
On Thursday, GBPUSD continued its negative trading for most of the day. There were quite specific reasons for this – the Bank of England announced that it kept the policy rate unchanged, although most market participants were expecting another hike. However, five members of the Monetary Policy Committee voted "against" the rate hike, and that was the minimum number of votes required to make such a decision. During the press conference, it was stated that the BoE is not putting an end to the tightening cycle but believes that the rate is already at a sufficiently restrictive level, so additional tightening is not required at this time. We believe that after such information, it was quite logical for the pound to fall.
Afterwards, the British currency did manage to continue its corrective move higher, but this doesn't change anything. The fundamental backdrop for the British currency has become even worse, so in the medium term, we expect it to continue its downward movement. The pound continues to lose bullish indicators. The downtrend line remains relevant.
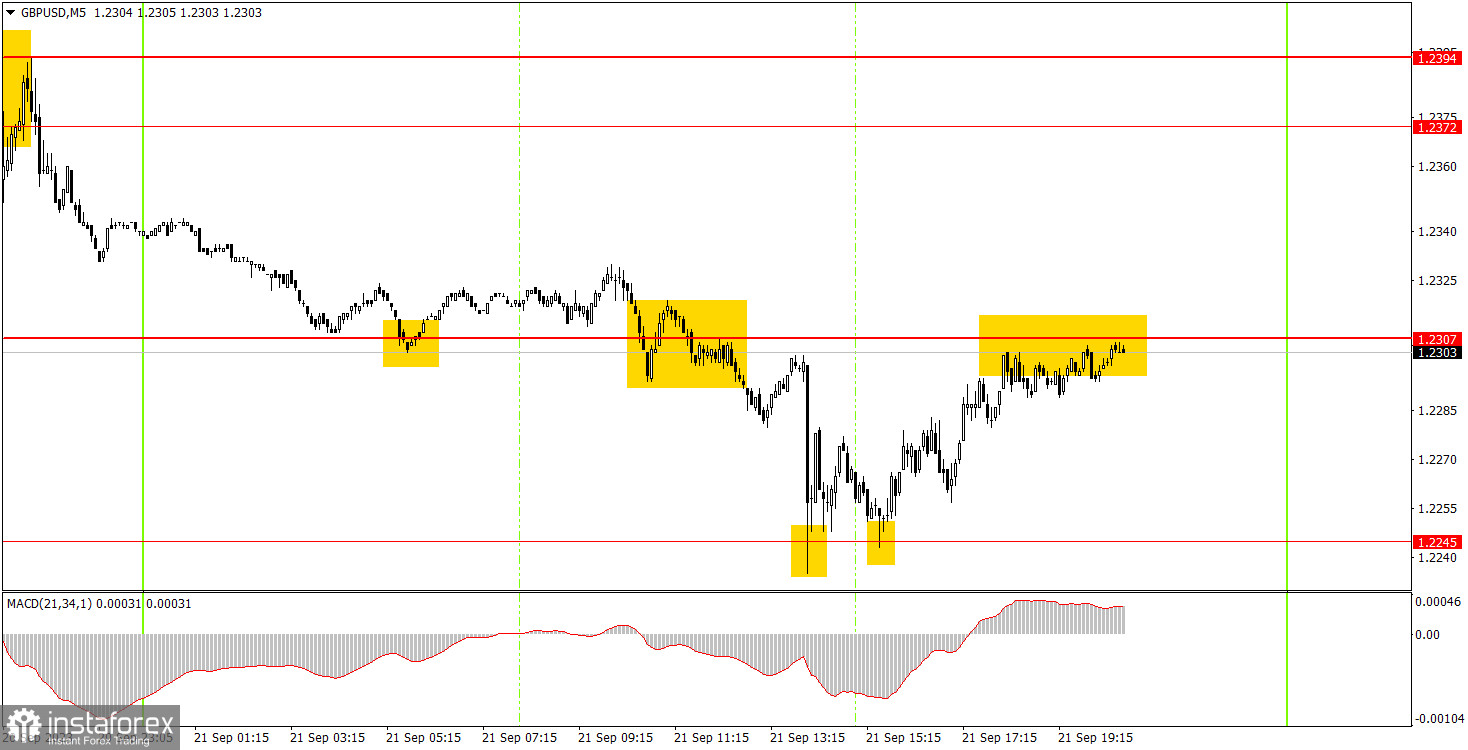
GBP/USD on 5M chart
There were a good amount of trading signals on the 5-minute chart, but the nature of the movement was far from ideal. This was due to the "emotional storm" that erupted after the BoE meeting. However, there were two signals formed around the level of 1.2387 before the results were announced. First, the pair bounced off this level but failed to move in the right direction by 20 pips. Then, a sell signal was formed, but it should not have been executed due to the proximity of the BOE meeting. Bounces from the level of 1.2245 could already be executed, and these signals, duplicating each other, allowed for a profit of about 35 pips. But due to the initial losing trade, the profit was quite small.
Trading tips on Friday:
On the 30-minute chart, GBP/USD has experienced two challenging days, with the downtrend still in place and the fundamental backdrop turning worse for the British currency. Therefore, it may enter a bullish correction in the near future, but in the long run, we expect the pound to continue falling. The key levels on the 5M chart are 1.2143, 1.2171-1.2179, 1.2245, 1.2307, 1.2372-1.2394, 1.2457-1.2488, 1.2544, 1.2605-1.2620, 1.2653, 1.2688. Once the price moves 20 pips in the right direction after opening a trade, you can set the stop-loss at breakeven. On Friday, traders now look to the release of the UK and US Manufacturing and Services PMIs. The UK PMIs will be significant for the pound, but in the US, the ISM PMIs are more important.
Basic trading rules:
1) The strength of the signal depends on the time period during which the signal was formed (a rebound or a break). The shorter this period, the stronger the signal.
2) If two or more trades were opened at some level following false signals, i.e. those signals that did not lead the price to Take Profit level or the nearest target levels, then any consequent signals near this level should be ignored.
3) During the flat trend, any currency pair may form a lot of false signals or do not produce any signals at all. In any case, the flat trend is not the best condition for trading.
4) Trades are opened in the time period between the beginning of the European session and until the middle of the American one when all deals should be closed manually.
5) We can pay attention to the MACD signals in the 30M time frame only if there is good volatility and a definite trend confirmed by a trend line or a trend channel.
6) If two key levels are too close to each other (about 5-15 pips), then this is a support or resistance area.
How to read charts:
Support and Resistance price levels can serve as targets when buying or selling. You can place Take Profit levels near them.
Red lines are channels or trend lines that display the current trend and show which direction is better to trade.
MACD indicator (14,22,3) is a histogram and a signal line showing when it is better to enter the market when they cross. This indicator is better to be used in combination with trend channels or trend lines.
Important speeches and reports that are always reflected in the economic calendars can greatly influence the movement of a currency pair. Therefore, during such events, it is recommended to trade as carefully as possible or exit the market in order to avoid a sharp price reversal against the previous movement.
Beginners should remember that every trade cannot be profitable. The development of a reliable strategy and money management are the key to success in trading over a long period of time.