Analyzing Thursday's trades:
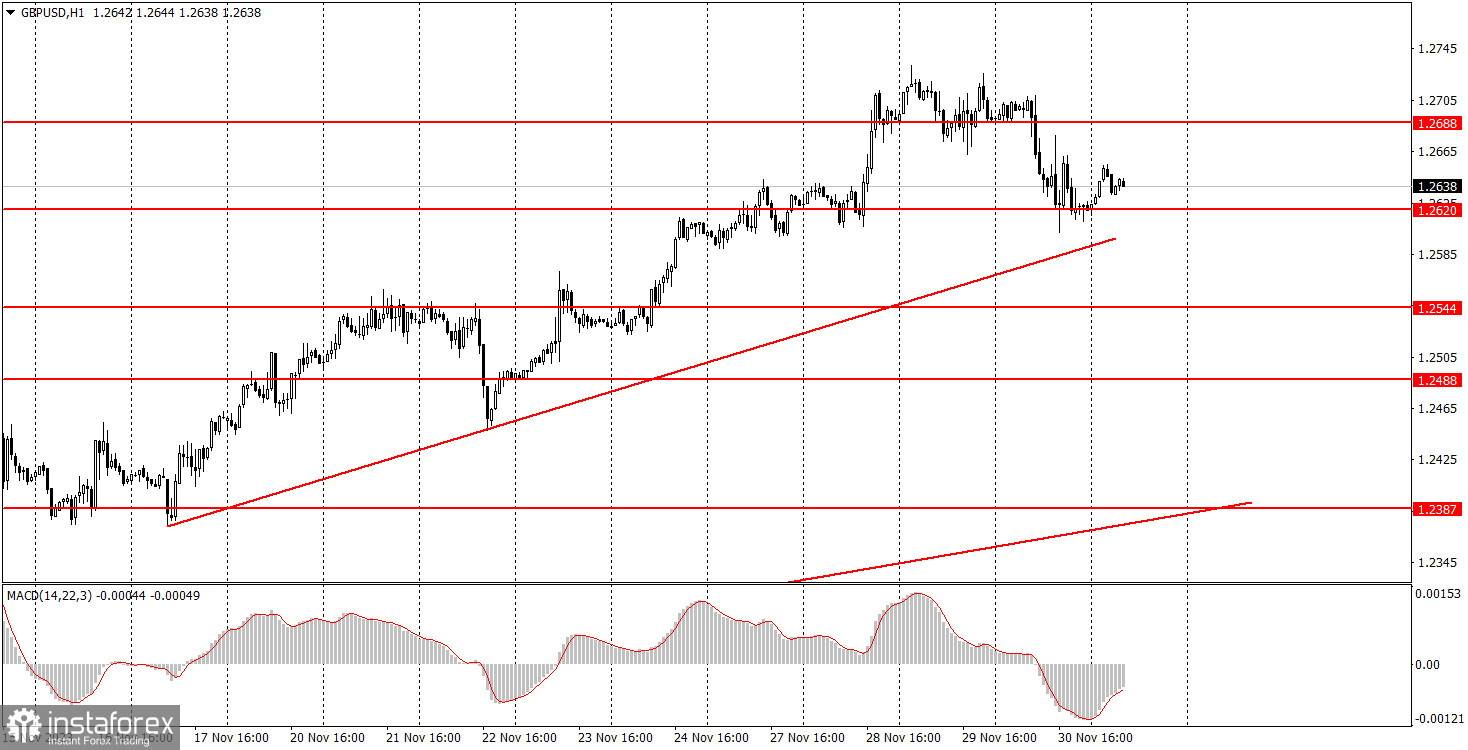
GBP/USD on 30M chart
GBP/USD also traded lower on Thursday, but at the moment, the downward movement appears so weak compared to the preceding growth that it looks like a minor retracement, and nothing more. Therefore, it is still too early to draw conclusions about the end of the uptrend. The pound has been rising for no particular reason or grounds in the last couple of weeks; the movement is driven by momentum. The first ascending trend line is so far from the price that the pair can fall by 200-300 pips, and the uptrend will still remain intact. We have formed a second trend line that is more relevant, and the price is currently not far from it. If the pound consolidates below it, we can expect the pair to fall to the level of 1.2387.
There were no significant events for the pound yesterday. And for the dollar too. The U.S. released several reports on personal income and consumer spending, as well as jobless claims. The U.S. reports did not move the market, as its values coincided with the forecasts. It seems that the traders only focused on the eurozone inflation data, which had a rather indirect relationship to the pound. Nevertheless, the euro pulled the pound down.
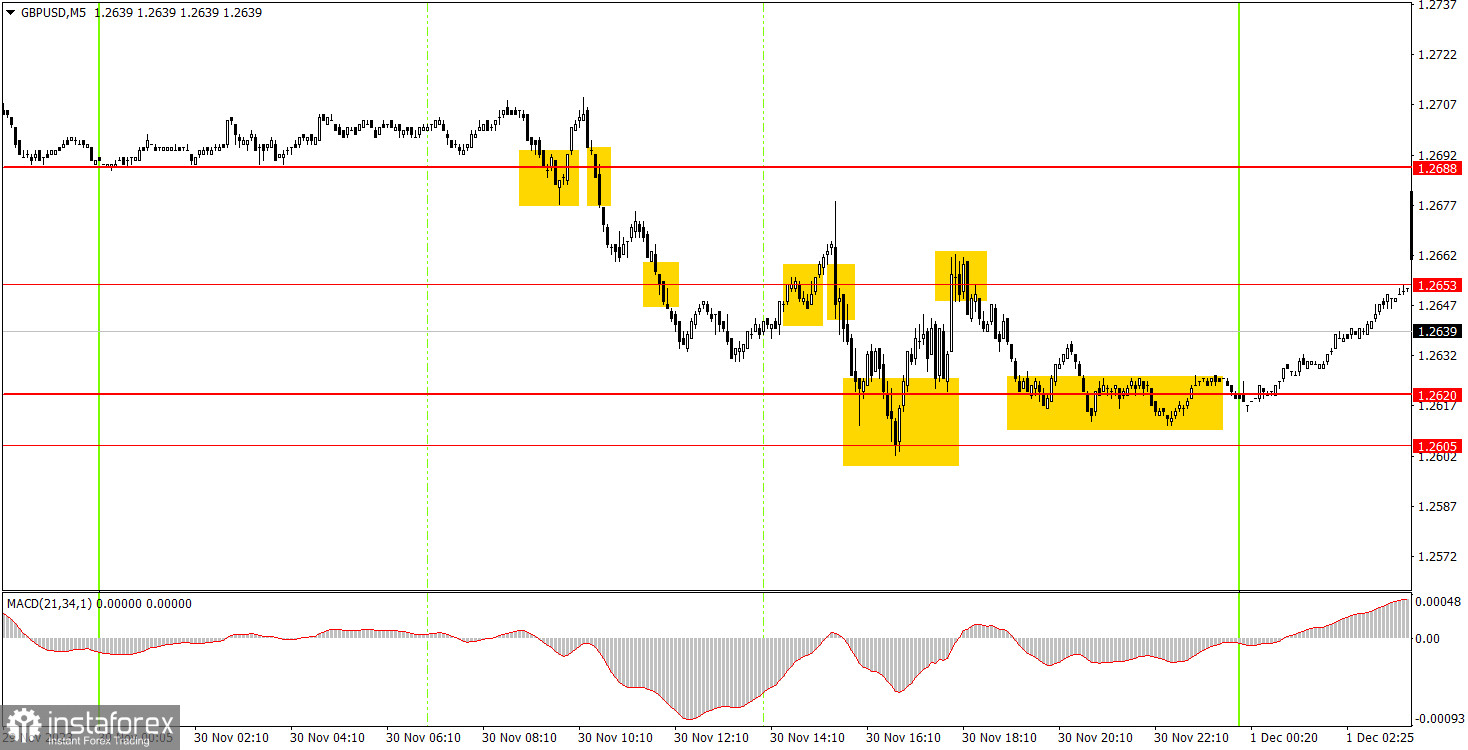
GBP/USD on 5M chart
Several signals were generated on the 5-minute chart, and we should carefully analyze them. During the European session, two signals were formed around the level of 1.2688, the first one turned out to be false. After the second signal, the price dropped below the level of 1.2653 but couldn't continue the decline immediately. Then there was a false buy signal around 1.2653 and there were several signals in the range between 1.2620 and 1.2653. In general, yesterday's movement was quite chaotic. The British pound seemed to have fallen, but it did so by a very narrow margin. Beginners could gain a few dozen pips of profit, but the nature of the movement and trading left much to be desired.
Trading tips on Friday:
On the 30-minute chart, the GBP/USD pair continues an uptrend. The anticipation is for this to conclude. Currently, we have two trend lines. Breaking either of them will pave the way for the pair to move further down, which we are waiting for. At the same time, as long as the uptrend persists, the pound may resume growth based on technical factors. The key levels on the 5M chart are 1.2270, 1.2310, 1.2372-1.2387, 1.2457-1.2488, 1.2544, 1.2605-1.2620, 1.2653, 1.2688, 1.2748, 1.2787-1.2791, 1.2848-1.2860. Once the price moves 20 pips in the right direction after opening a trade, you can set the stop-loss at breakeven. On Friday, the UK will publish the Manufacturing Purchasing Managers' Index (PMI), which traders will likely ignore, and in the US, Federal Reserve Chair Jerome Powell will speak, and the ISM Manufacturing Index, which is quite crucial, will be released. These last two events can provoke a strong market reaction.
Basic trading rules:
1) Signal strength is determined by the time taken for its formation (either a bounce or level breach). A shorter formation time indicates a stronger signal.
2) If two or more trades around a certain level are initiated based on false signals, subsequent signals from that level should be disregarded.
3) In a flat market, any currency pair can produce multiple false signals or none at all. In any case, the flat trend is not the best condition for trading.
4) Trading activities are confined between the onset of the European session and mid-way through the U.S. session, after which all open trades should be manually closed.
5) On the 30-minute timeframe, trades based on MACD signals are only advisable amidst substantial volatility and an established trend, confirmed either by a trendline or trend channel.
6) If two levels lie closely together (ranging from 5 to 15 pips apart), they should be considered as a support or resistance zone.
How to read charts:
Support and Resistance price levels can serve as targets when buying or selling. You can place Take Profit levels near them.
Red lines represent channels or trend lines, depicting the current market trend and indicating the preferable trading direction.
The MACD(14,22,3) indicator, encompassing both the histogram and signal line, acts as an auxiliary tool and can also be used as a signal source.
Significant speeches and reports (always noted in the news calendar) can profoundly influence the price dynamics. Hence, trading during their release calls for heightened caution. It may be reasonable to exit the market to prevent abrupt price reversals against the prevailing trend.
Beginners should always remember that not every trade will yield profit. Establishing a clear strategy coupled with sound money management is the cornerstone of sustained trading success.