empty
 
 
05.12.2022 03:15 PM
ETHUSD Potential For Bearish Drop | 5th December 2022

This image is no longer relevant

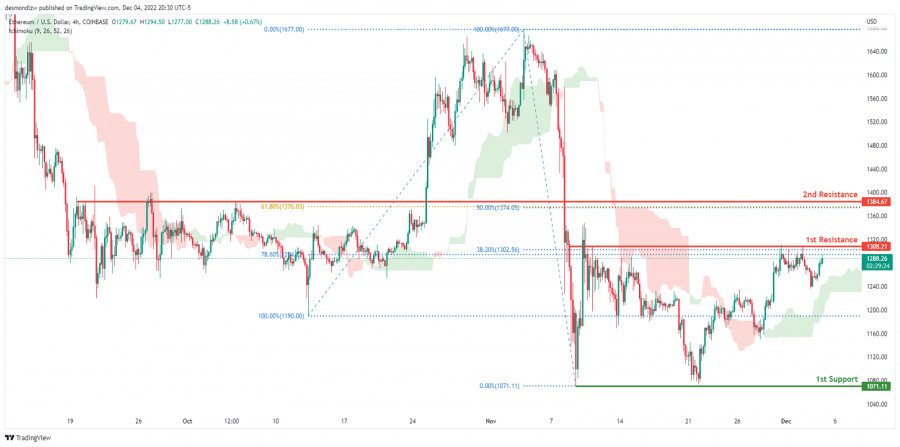
On the H4 chart, the overall bias for ETHUSD is bearish. However, the price is now above the Ichimoku cloud which might indicate a short-term shift to a bullish market. Expecting price to possibly break the 1st resistance at 1308.21, where the 38.2% and 78.6% Fibonacci lines are before heading towards the 2nd resistance line at 1384.67, where the 50% and 61.8% Fibonacci lines are. In an alternative scenario, price could possibly head back down towards the 1st support at 1071.11, where the previous swing low is.

Trading Recommendation

Entry: 1308.21

Reason for Entry: 1st resistance line

Take Profit:1071.11

Reason for Take Profit: 1st support line

Stop Loss: 1677.00

Reason for Stop Loss:

Slightly above where the 2nd resistance line is located.

EURUSD
Euro vs US Dollar
Select timeframe
5
min
15
min
30
min
1
hour
4
hours
1
day
1
week
Start trade
Start trade
XAUUSD, Day | Potential Reversal from a key level ?
The XAU/USD chart currently has bearish momentum, with potential for a drop towards the first support level at 1948, an overlap support level. If prices continue to fall, they could test the second support level at 1881, another overlap support level and the 61.80% Fibonacci retracement level. The.
Autore: Dean Leo
01:49 2023-03-27 UTC--4
1105
XAUUSD, Day | Continue to 1st Support?
BTC/USD chart shows bearish momentum with potential for drop to first support level. Overall, Bitcoin's momentum against the US dollar is bearish, suggesting possible further price decline. A bearish reaction from the first resistance level could lead to a drop towards the first support level at.
Autore: Dean Leo
01:48 2023-03-27 UTC--4
1075
WIT(OIL), Day | Strong descending trendline ?
WTI oil prices have turned bearish as they fell below a crucial support level. The chart indicates that the momentum has shifted to the downside, signaling a potential further decline in prices. Consequently, the overall bias for WTI oil prices is now bearish. In the near term, prices could.
Autore: Dean Leo
01:46 2023-03-27 UTC--4
1030
Mostra di più
  • Grand Choice
    Contest by
    InstaForex
    InstaForex always strives to help you
    fulfill your biggest dreams.
    JOIN CONTEST
  • Chancy Deposit
    Deposit your account with $3,000 and get $8000 more!
    In March we raffle $8000 within the Chancy Deposit campaign!
    Get a chance to win by depositing $3,000 to a trading account. Having fulfilled this condition, you become a campaign participant.
    JOIN CONTEST
  • Trade Wise, Win Device
    Top up your account with at least $500, sign up for the contest, and get a chance to win mobile devices.
    JOIN CONTEST
  • 100% Bonus
    Your unique opportunity to get a 100% bonus on your deposit
    GET BONUS
  • 55% Bonus
    Apply for a 55% bonus on your every deposit
    GET BONUS
  • 30% Bonus
    Receive a 30% bonus every time you top up your account
    GET BONUS

Recommended Stories

BTC/USD, D1: possibile inversione ribassista. Previsione per il 14 marzo 2023

Attualmente, la coppia BTC/USD sta testando il livello di resistenza principale a 1,674, che è il massimo oscillante. Un'inversione da qui potrebbe spingere le quotazioni verso 1,357

Dean Leo 09:01 2023-03-14 UTC+2

USD/CHF, D1: atteso rimbalzo rialzista. Previsione per il 14 marzo 2023

Attualmente la coppia USD/CHF sta testando il livello di supporto principale di 0,9083 corrispondente al livello swing low. Un rimbalzo da qui potrebbe portare ad un aumento delle quotazioni fino

Dean Leo 09:01 2023-03-14 UTC+2

EUR/JPY, H4 | È prevista l'inversione di prezzo dal livello di resistenza principale

Il prezzo si sta spostando verso la resistenza di 1,4639, che è anche un massimo locale. L'inversione da questo segno potrebbe portare a un calo del prezzo al livello

Dean Leo 07:26 2023-03-10 UTC+2

EUR/CHF, H4 | Rottura ribassista possibile

Il prezzo ha sfondato il livello di supporto chiave di 0,9917, che ora si è trasformato in resistenza, provocando una caduta al livello di take-profit target di 0,9851

Dean Leo 07:26 2023-03-10 UTC+2

EUR/USD e GBP/USD 9 marzo: analisi tecnica della situazione

Il giorno prima c'è stato un altro cambiamento nelle priorità giornaliere, a causa del quale la coppia si è trovata sotto il supporto mensile (1,0579), nella zona ribassista relativa alla

Evangelos Poulakis 09:57 2023-03-09 UTC+2

Analisi tecnica settimanale: coppia di valute EUR/USD dal 6 all'11 marzo

La scorsa settimana, la coppia, salendo, ha testato 21 linee medie semplici a 1,0688 (linea tratteggiata nera) ed è scesa, chiudendo la candela settimanale a 1,0634. Lavoro al rialzo possibile

Stefan Doll 09:25 2023-03-06 UTC+2

Analisi tecnica settimanale: coppia di valute GBP/USD dal 6 all'11 febbraio

La scorsa settimana la coppia, salendo, ha testato il livello di ritracciamento del 14,6%, 1,2142 (linea tratteggiata gialla), ed è scesa, chiudendo la candela settimanale a 1,2040. Questa settimana

Stefan Doll 09:25 2023-03-06 UTC+2

EURUSD costruisce il supporto

Scala EURUSD H4 L'euro, a quanto pare, ha esaurito il suo potenziale di caduta. La scorsa settimana, alla notizia di un'inflazione superiore alle attese negli Stati Uniti, l'euro non solo

Jozef Kovach 08:38 2023-03-01 UTC+2

EUR/USD e GBP/USD 28 febbraio – analisi tecnica della situazione

Dopo aver aggiornato il minimo della scorsa settimana, i ribassisti hanno ceduto alla nuova attività dell'avversario. Di conseguenza, i tori sono riusciti a organizzare un rialzo produttivo e hanno riportato

Evangelos Poulakis 06:44 2023-02-28 UTC+2

EUR/USD e GBP/USD 23 febbraio – analisi tecnica della situazione

Ieri i venditori hanno aggiornato il minimo della scorsa settimana (1,0613) e chiuso la giornata sotto il supporto mensile (1,0611). Il mantenimento delle posizioni raggiunte aprirà nuovi punti di riferimento

Evangelos Poulakis 06:54 2023-02-23 UTC+2
In questo momento non potete parlare al telefono?
Ponete la vostra domanda nella chat.