

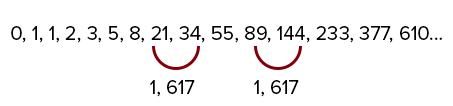
What are Fibonacci numbers?

Leonardo the Pisan is the first major mathematician of medieval Europe. He is best known by the name Fibonacci. The most famous achievement of Fibonacci is description of the sequence of numbers where each successive number is equal to the sum of the two preceding ones. As a result, the sequence 0, 1, 1, 2, 3, 5, 8, 21, 34, 55, 89, 144, 233, 377, 610... was introduced.
If we divide each successive number by the previous one, we get a result close to 1.618. This number was called the Golden ratio. Many people believe that 1.618 is a magic number. It was used for construction of the Egyptian pyramids, ancient temples and tombs. The Golden ratio and the Fibonacci numbers reflect proportions in the natural world, including human body.
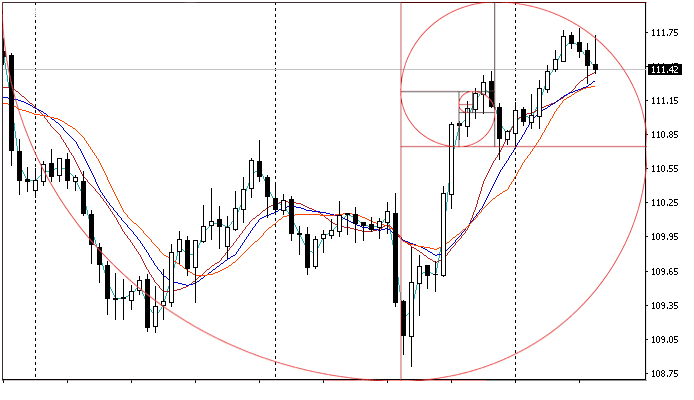
If we divide any number of the sequence by the next number in the sequence, we get a ratio of 0.36. On the basis of correlation of the subsequent members to the previous ones, experts developed a unique series of numbers, which is very often used in currency and futures markets. Using these numbers, a trader can calculate price retracement in relation to the prior move or determine the ratio of the target to the previous correction.
Fibonacci numbers can be corrective and impulse
50.0%; 61.8%; 76.4%; 88.2%;
261.8%; 300.0%; 338.2%; 400.0%; 423.6%;
All of them are already included in the software of trading platforms.
Market correction and Fibonacci numbers
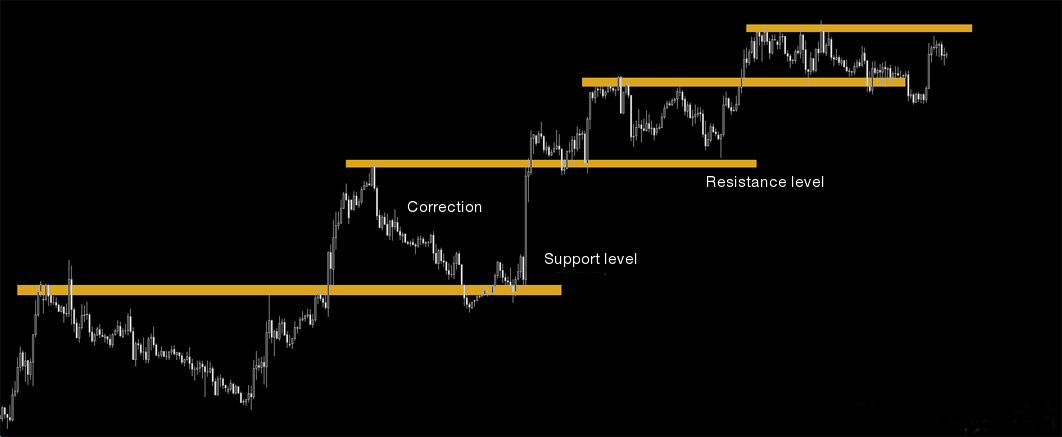
As a rule, after strong impulses, a price starts to move in the opposite direction. In trading this movement is called retracement or correction. If you correctly use the Fibonacci grid, then you can easily determine the retracement range and see when you can re-enter the market in the direction of the trend.
However, these retracements do not always exactly correspond to the Fibonacci numbers. For more accurate analysis, it is necessary to track candle patterns at the moment when the price reaches these levels. If the chart shows a reversal pattern, then the price is likely to rebound from this level.
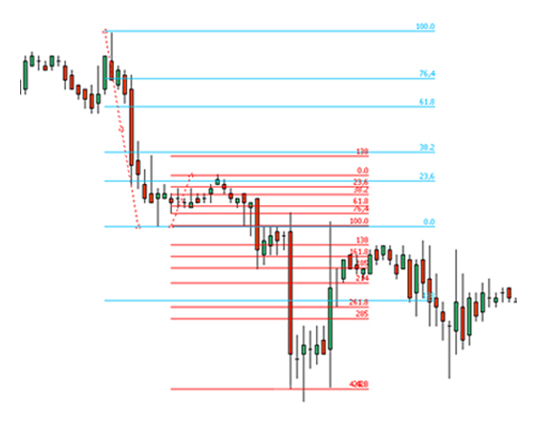
Fibonacci numbers and new trend targets
The Fibonacci numbers are very helpful not only in determining correction levels. The Fibonacci grid allows traders to precisely determine new targets that the price can reach when a trend moves impulsively.
One of the generally accepted rules is that if the price correction was 38.2% or less, its target should be set at 261.8% or even 423.6% of the correction. If there is a strong correction on the market, then the target should be set at 161.8% of its value.
The Fibonacci numbers are one of the most powerful tools of technical analysis in the Forex market. The use of the Fibonacci numbers in combinations with analytical tools to determine the limits of corrections and targets are very helpful for trading on Forex.


