Analyzing Friday's trades:
EUR/USD on 30M chart
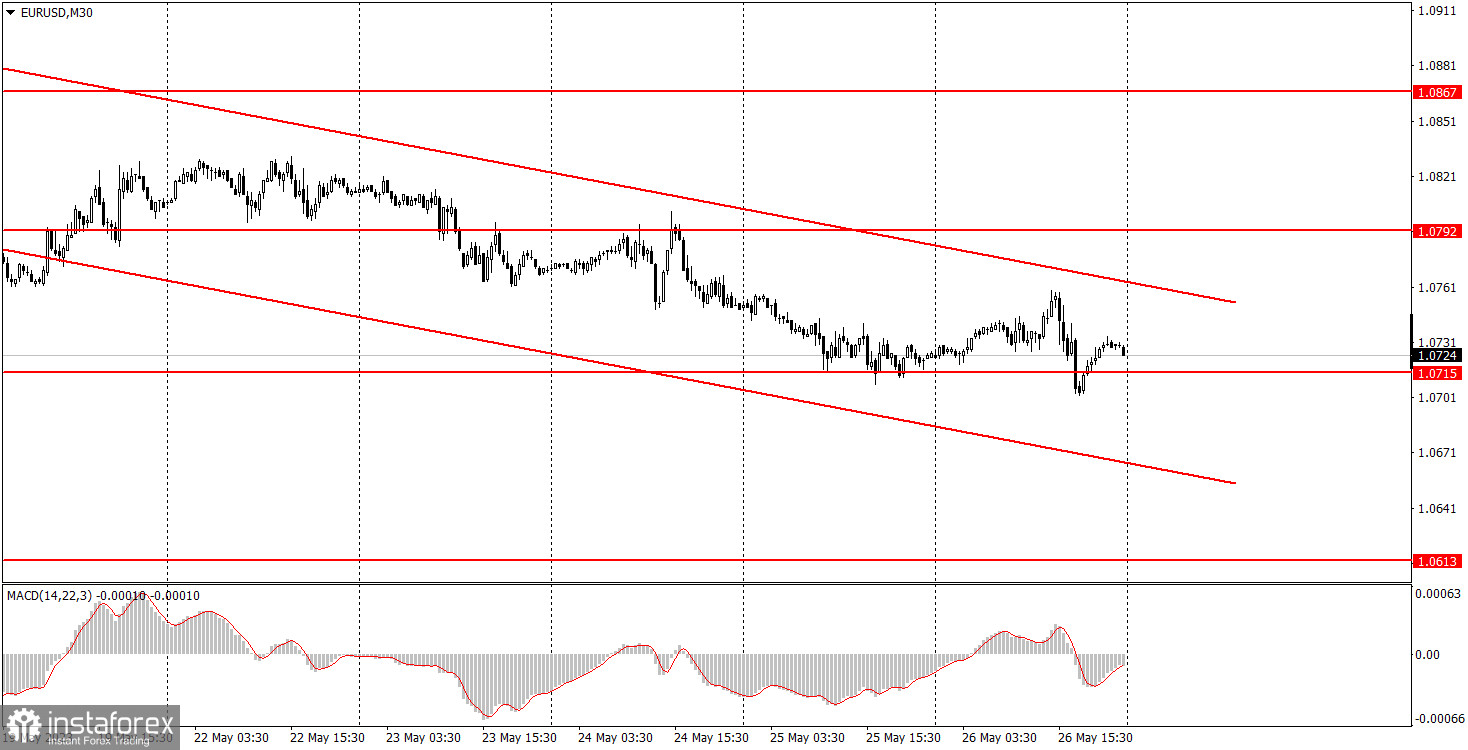
EUR/USD continued its sluggish but steady downward movement on Friday. We have repeatedly mentioned that the current movement is extremely weak, making it difficult to trade on the 5-minute or slightly higher charts. If the pair moves 50 pips in a day, how can one profit from it? Friday was yet another confirmation of this. Until the US trading session, the price only moved upwards and managed to cover a distance of about 40 pips in 15 hours. Afterwards, several secondary reports were published in the US, but one of them significantly deviated from the forecasted value, which triggered a reaction and, as a result, strengthened the US dollar. This report was about durable goods orders. Traders expected a decrease of 1.1% in its volume, but in reality, it increased by 1.1%. Therefore, it was logical for the dollar to get stronger, but what's the point (even intraday) if the pair returned to its initial positions by the end of the day?
EUR/USD on 5M chart
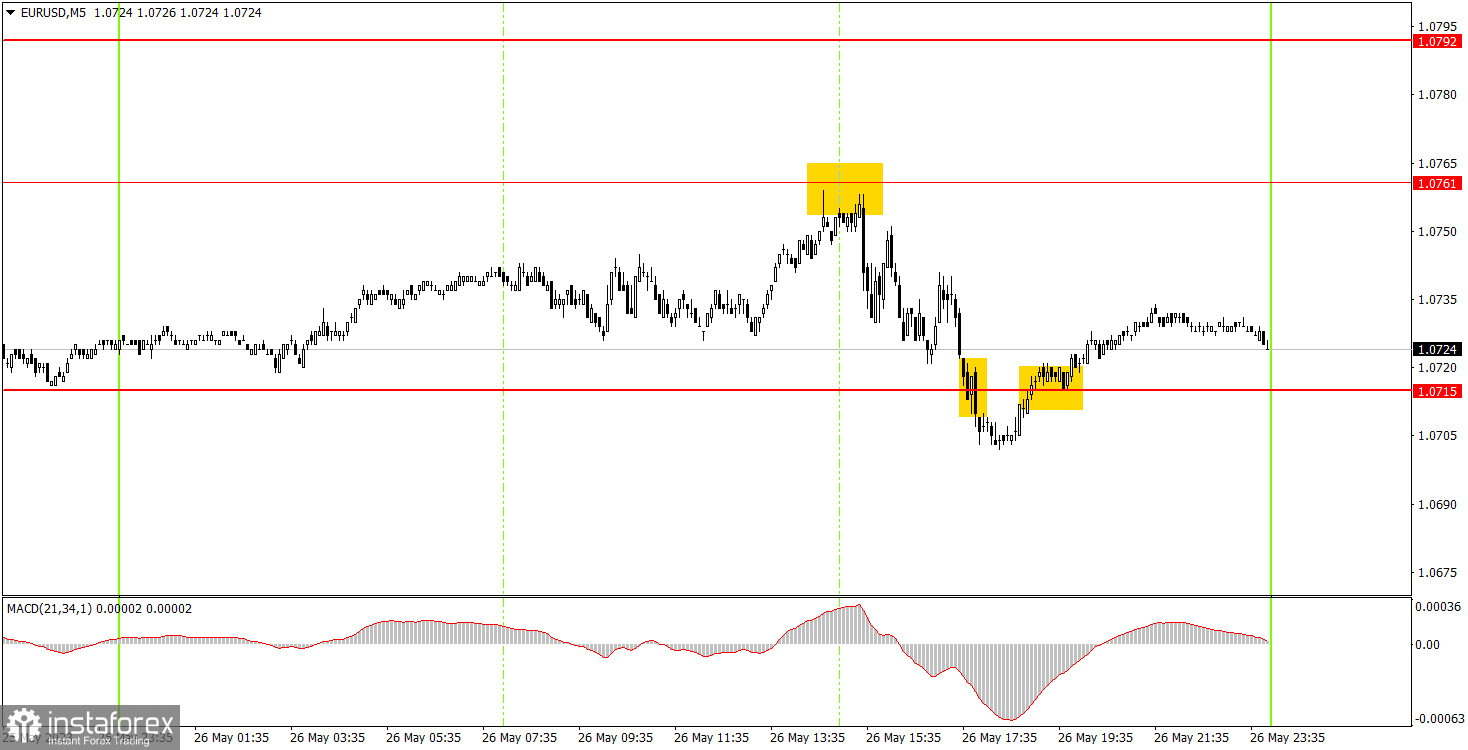
The 5M chart shows how weak the movement was on Friday. There were no signals during the European trading session, and that's a good thing! There would only be losses with such movement anyway. Then there was a rebound from the level of 1.0761, which occurred half an hour before US reports were published. Therefore, you could have opened a short position, with a Stop Loss in place, as the market reaction could have been unpredictable. As a result, the pair started a downward movement, but couldn't go significantly below the nearest target of 1.0715. It was time to close short positions when the price settled above this level, resulting in a profit of about 25 pips.
Trading tips on Monday:
As seen on the 30M chart, the pair continued moving downward. The bearish trend has been developing for 2 weeks already, which totally matches our expectations. In the nearest future, the upward correction is likely to start, though the descending channel still indicates continuation of the downtrend. The US dollar is rightfully gaining strength regardless of the fundamental and macroeconomic background. The key levels on the 5M chart are 1.0607-1.0613, 1.0715, 1.0761, 1.0792, 1.0857-1.0867, 1.0918-1.0933. A stop loss can be set at a breakeven point as soon as the price moves 15 pips in the right direction. There are no significant events scheduled for Monday in the eurozone or the US. Volatility may be even lower than usual, and we shouldn't expect significant intraday trending movement. Most likely, we can expect a "boring Monday."
Basic rules of the trading system:
1) The strength of the signal depends on the time period during which the signal was formed (a rebound or a break). The shorter this period, the stronger the signal.
2) If two or more trades were opened at some level following false signals, i.e. those signals that did not lead the price to Take Profit level or the nearest target levels, then any consequent signals near this level should be ignored.
3) During the flat trend, any currency pair may form a lot of false signals or do not produce any signals at all. In any case, the flat trend is not the best condition for trading.
4) Trades are opened in the time period between the beginning of the European session and until the middle of the American one when all deals should be closed manually.
5) We can pay attention to the MACD signals in the 30M time frame only if there is good volatility and a definite trend confirmed by a trend line or a trend channel.
6) If two key levels are too close to each other (about 5-15 pips), then this is a support or resistance area.
How to read charts:
Support and Resistance price levels can serve as targets when buying or selling. You can place Take Profit levels near them.
Red lines are channels or trend lines that display the current trend and show which direction is better to trade.
MACD indicator (14,22,3) is a histogram and a signal line showing when it is better to enter the market when they cross. This indicator is better to be used in combination with trend channels or trend lines.
Important speeches and reports that are always reflected in the economic calendars can greatly influence the movement of a currency pair. Therefore, during such events, it is recommended to trade as carefully as possible or exit the market in order to avoid a sharp price reversal against the previous movement.
Beginners should remember that every trade cannot be profitable. The development of a reliable strategy and money management are the key to success in trading over a long period of time.