Analysis of EUR/USD 5M
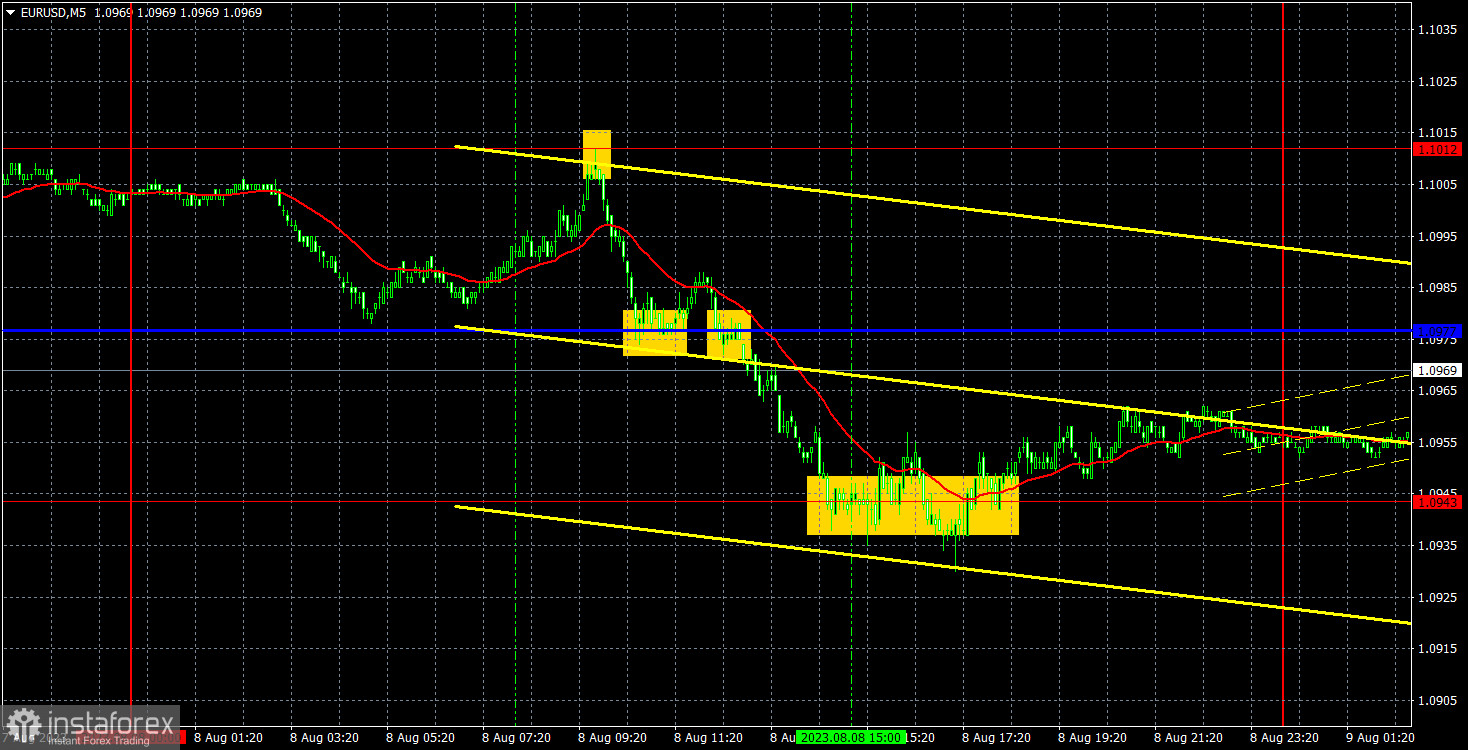
Moderate levels of EUR/USD volatility on Tuesday, with the pair showing adequate movements. Volatility was quite decent alongside no significant economic data and in the absence of fundamental events. Thus, the euro's decline in the first half of the day looks somewhat odd, considering the more probable corrective scenario. However, if we view the situation from a different angle, we can see that the market continues to show optimism towards the US dollar. The euro has been rising for a while, often without a solid reason. It seems that now it is the dollar's moment to shine.
There were a decent amount of trading signals on Tuesday. Initially, the pair rebounded from the level of 1.1012 and dropped to a critical line. Unfortunately, this was followed by a bounce that spoiled an excellent sell signal. Traders could have reacted to this bounce by closing short positions and opening longs, but the signal turned out to be false. Therefore, when confirming a move below the Kijun-sen line, it was advisable to open short positions again. Eventually, the pair dropped to the level of 1.0943, from which it bounced imprecisely. As a result, the outcomes for three trades were as follows: +20 pips, -10 pips, +20 pips. Not a bad result overall.
COT report:
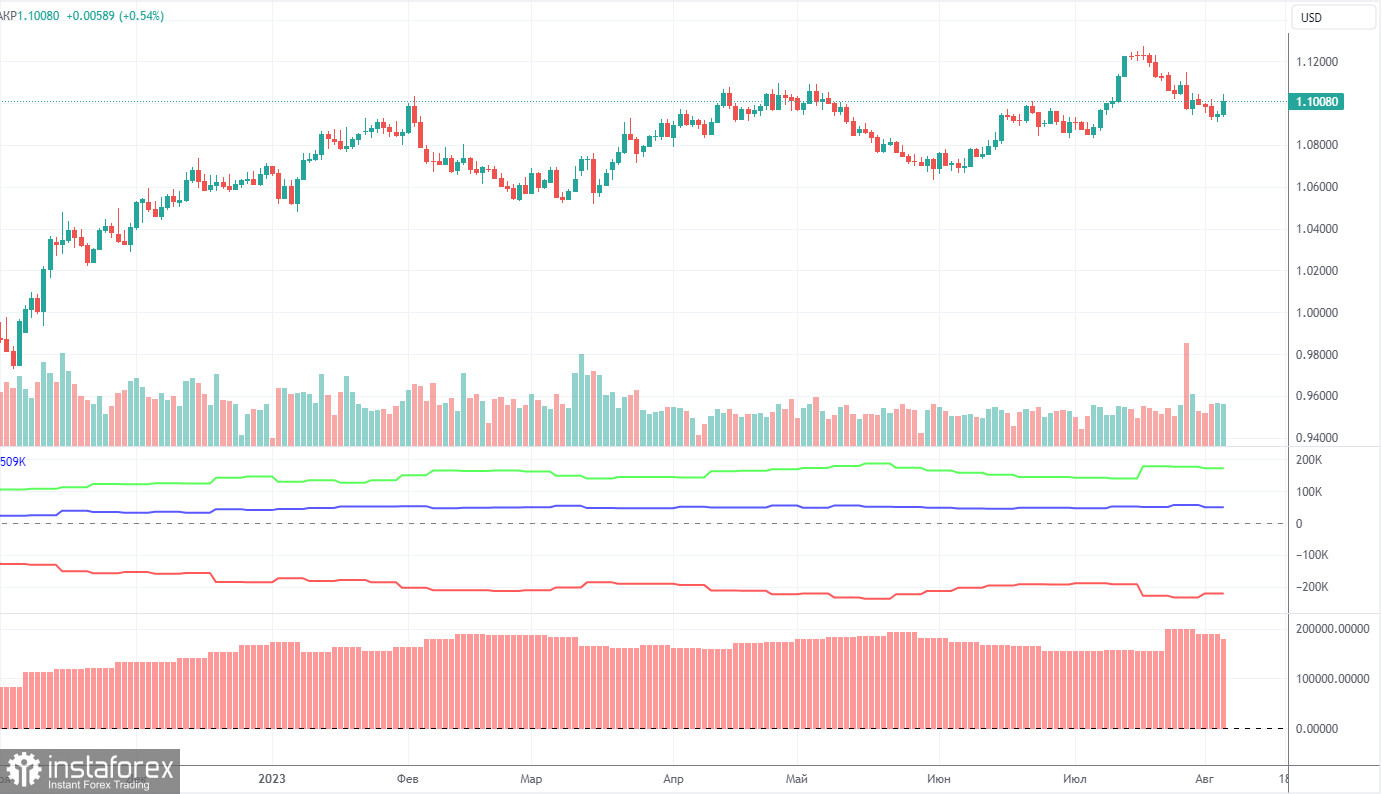
On Friday, a new COT report for August 1 was released. In the last 10 months, COT reports fully corresponded to what is happening in the market. The chart above clearly shows that the net position of major traders (the second indicator) began to grow in September 2022 and at about the same time the euro started climbing too. In the last 5-6 months, the net position has not risen but the euro remains at very high levels. At the moment, the net position of non-commercial traders is bullish and remains strong. The euro keeps climbing against the US dollar.
I have already mentioned the fact that a fairly high value of the net position signals the end of an uptrend. This is also confirmed by the first indicator where the red and green lines are very far from each other. Usually, it precedes the end of the trend. During the last reporting week, the number of long positions of the non-commercial group of traders fell by 10,500 and the number of short ones by 5,400. The net position decreased by 5,100 contracts. The number of long positions is higher than the number of short ones of non-commercial traders by 172,000. This is a very large gap as the difference is almost threefold. Even without COT reports, it is obvious that the euro should decline but speculators are still in no hurry to sell.
Analysis of EUR/USD 1H
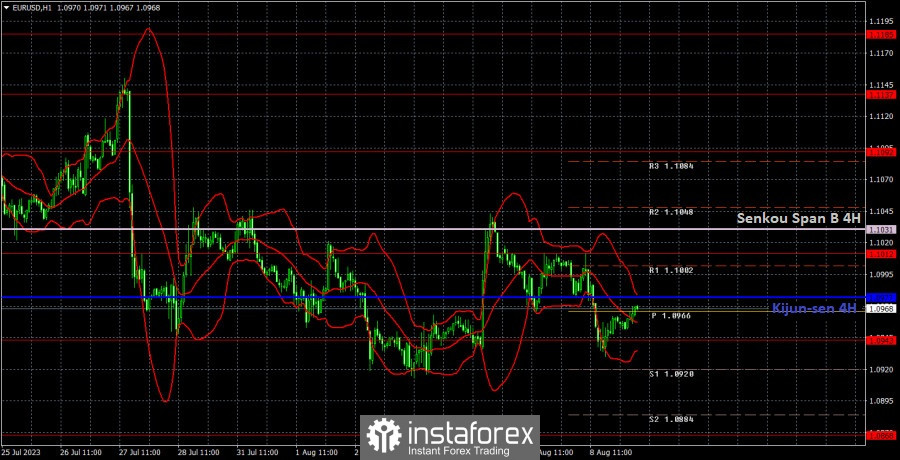
On the 1H chart, the downtrend persists. We believe that the euro should fall in the medium-term period. Currently, the price is below all the lines of the Ichimoku indicator. There are hardly any important reports this week, so movements might resemble a flat. If we look at the hourly chart, we can see that they strongly resemble such a pattern.
On August 9, traders should pay attention to the following key levels: 1.0762, 1.0806, 1.0868, 1.0943, 1.1012, 1.1092, 1.1137, 1.1185, 1.1274, as well as the Senkou Span B line (1.1031) and the Kijun-sen line (1.0977). The lines of the Ichimoku indicator can move during the day, which should be taken into account when determining trading signals. There are support and resistance levels that can be used to lock in profits. Traders look for signals at rebounds and breakouts. It is recommended to set the Stop Loss orders at the breakeven level when the price moves in the right direction by 15 pips. This will protect against possible losses if the signal turns out to be false.
Today, there are no important events or reports lined up in the EU and the US. Since there are no significant market triggers for the day, we should probably brace ourselves for moderate levels of volatility. On the hourly chart, the pair may probably move sideways instead of showing a trend.
Description of the chart:
Support and resistance levels are thick red lines near which the trend may end. They do not provide trading signals;
The Kijun-sen and Senkou Span B lines are the lines of the Ichimoku indicator, plotted to the 1H timeframe from the 4H one. They provide trading signals;
Extreme levels are thin red lines from which the price bounced earlier. They provide trading signals;
Yellow lines are trend lines, trend channels, and any other technical patterns;
Indicator 1 on the COT charts is the net position size for each category of traders;
Indicator 2 on the COT charts is the net position size for the Non-commercial group.