Analysis of EUR/USD 5M
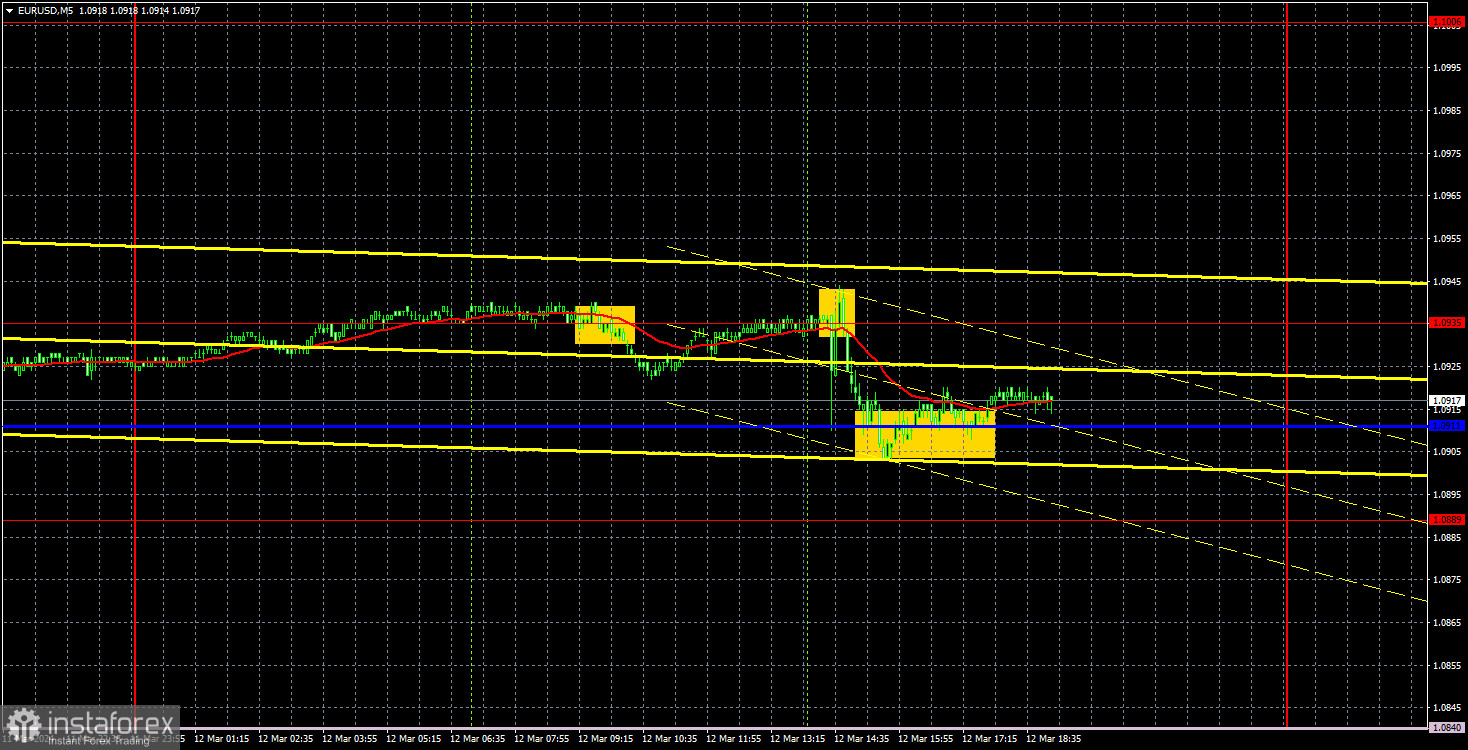
EUR/USD extended a weak bearish correction on Tuesday. We anticipated that the U.S. inflation report would trigger market emotions. The dollar rose, but its strength was surprising. The U.S. dollar strengthened by 20 pips after it was revealed that U.S. inflation continues to be stagnant. At the end of February, the Consumer Price Index rose to 3.2% on an annual basis. As we have repeatedly mentioned, we're seeing an increasing likelihood of a much later start to the Federal Reserve's monetary easing cycle. Along with it, the U.S. dollar should rise unless the market reverts to its old habits of refusing to buy the dollar for no reason.
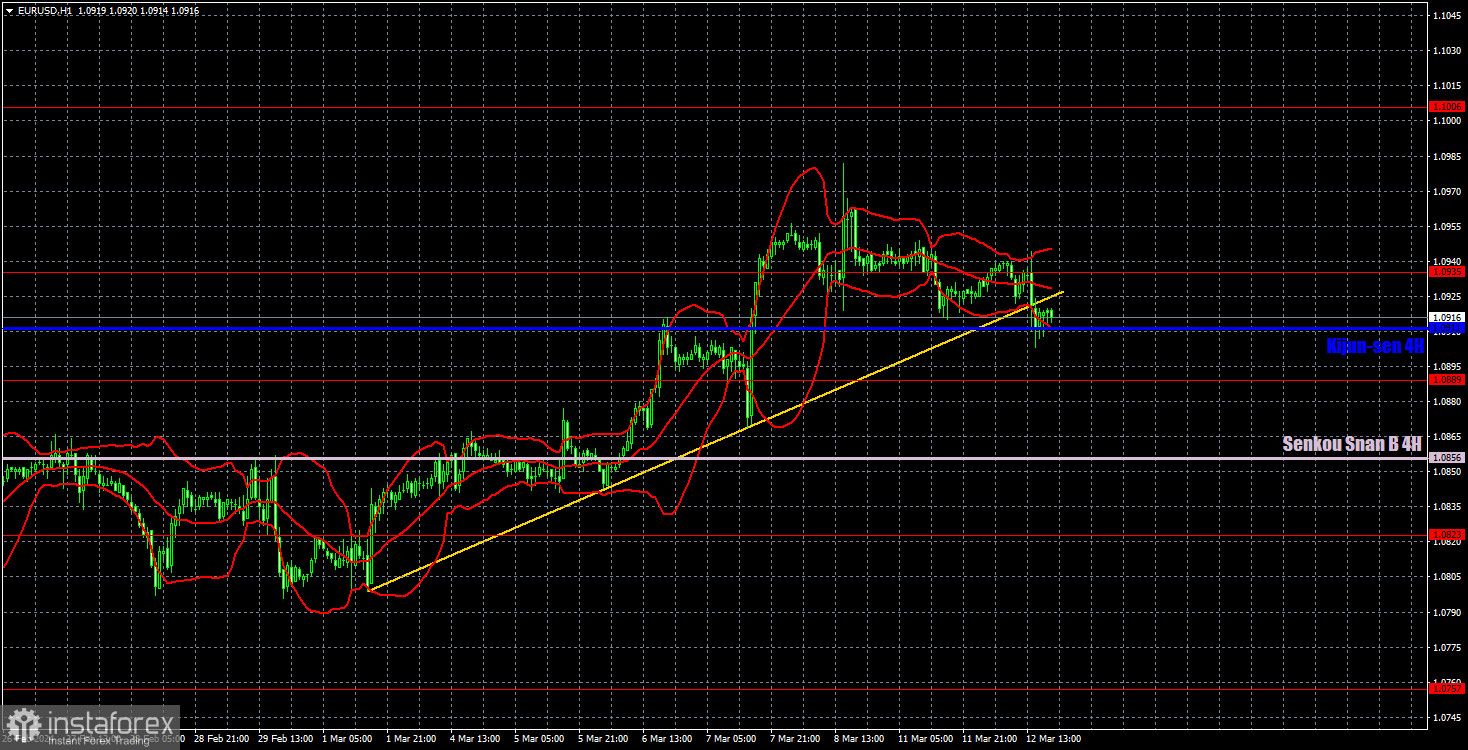
The pair breached the ascending trend line, but the critical Kijun-sen line remained firm. Therefore, the euro may rise at any moment. This doesn't even require significant fundamental or macroeconomic data. The market is ready to buy anything, as long as it's not the dollar. If the price breaches the critical line, then we can expect the pair to fall to the Senkou Span B line.
It's not even worth discussing Tuesday's trading signals. Volatility was low, so we didn't see any strong movements or signals. The price bounced twice from the 1.0935 level, but all it managed to reach was the Kijun-sen line, which was 24-pips away. Traders could expect to earn these 24 pips, minus 10-15 points for entering and leaving a trade on Tuesday. Regardless of the trading system, if the pair moves only 30-40 pips a day, it is inherently difficult to make money.
COT report:
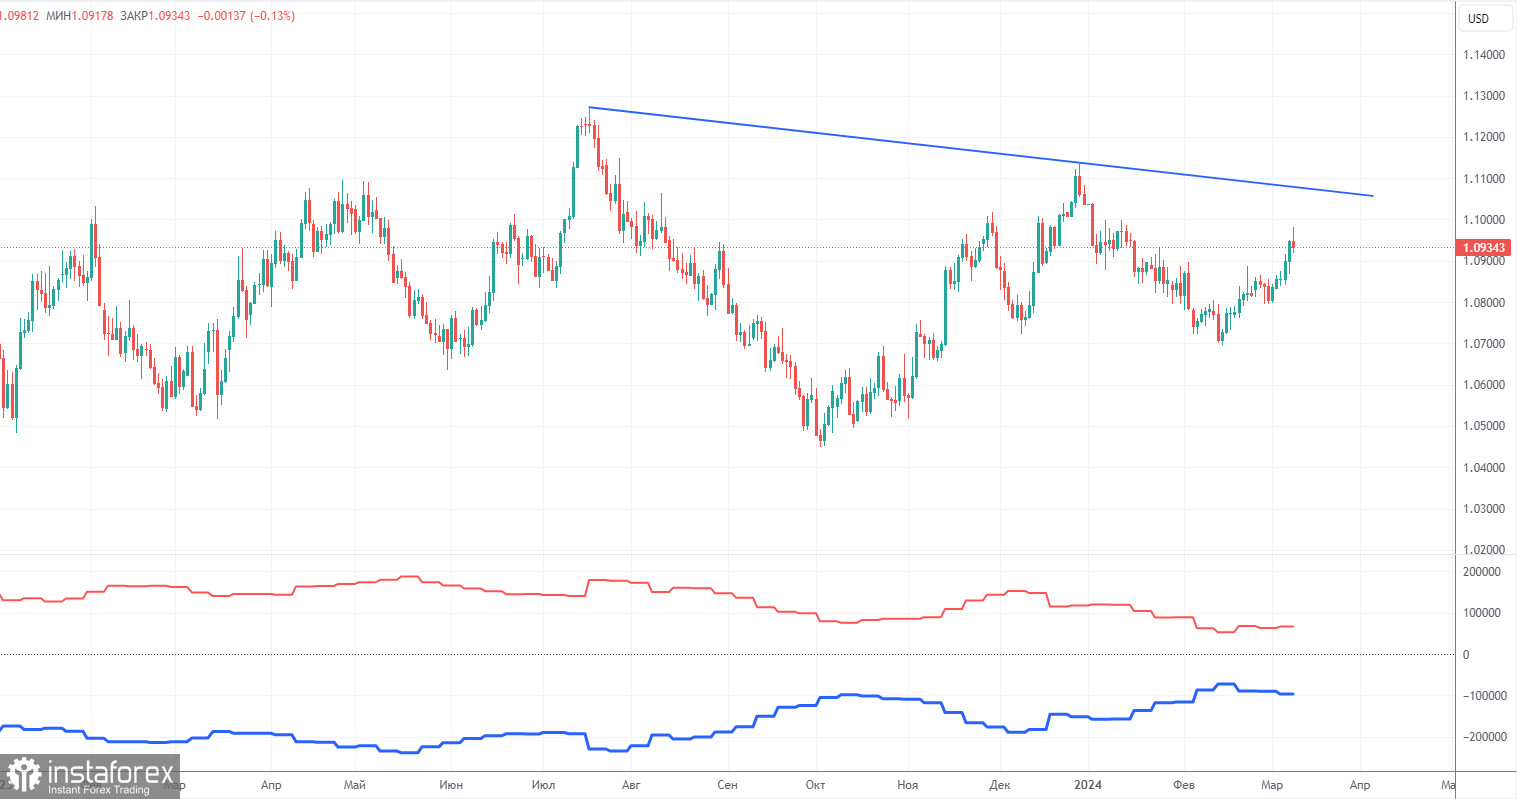
The latest COT report is dated March 5. The net position of non-commercial traders has been persistently bullish for quite some time. Basically, the number of long positions in the market is higher than the number of short positions. However, at the same time, the net position of non-commercial traders has been decreasing in recent months, while that of commercial traders has been increasing. This shows that market sentiment is turning bearish, as speculators are increasing the volume of short positions on the euro. We don't see any fundamental factors that can support the euro's growth in the long term, while technical analysis also points to the formation of a downtrend.
We have already drawn your attention to the fact that the red and blue lines have significantly diverged, often preceding the end of a trend. Currently, these lines are moving towards each other (indicating a trend reversal). Therefore, we believe that the euro will fall further. During the last reporting week, the number of long positions for the non-commercial group decreased by 5,200, while the number of short positions decreased by 8,600. Accordingly, the net position increased by 3,400, which is relatively small. The number of buy contracts is still higher than the number of sell contracts among non-commercial traders by 66,000 (previously 63,000). Thus, commercial traders continue to sell the euro.
Analysis of EUR/USD 1H
On the 1-hour chart, the uptrend remains intact. In our opinion, all the factors currently suggest that the dollar will strengthen, but the market is still buying the euro for no apparent reason. Therefore, we expect the pair to resume its downward movement, but initially, it needs to overcome the Kijun-sen line. Without this breakthrough, the euro could rise at any moment.
On March 13, we highlight the following levels for trading: 1.0530, 1.0581, 1.0658-1.0669, 1.0757, 1.0823, 1.0889, 1.0935, 1.1006, 1.1092, as well as the Senkou Span B line (1.0856) and Kijun-sen line (1.0911). The Ichimoku indicator lines can move during the day, so this should be taken into account when identifying trading signals. Don't forget to set a Stop Loss to breakeven if the price has moved in the intended direction by 15 pips. This will protect you against potential losses if the signal turns out to be false.
On Wednesday, the Eurozone will release a secondary report on industrial output, while there are no significant events lined up for the U.S.. It seems that we're in for another day of low volatility and quiet movements... Unfortunately, the pair has been trading in such a format for the past month and a half.
Description of the chart:
Support and resistance levels are thick red lines near which the trend may end. They do not provide trading signals;
The Kijun-sen and Senkou Span B lines are the lines of the Ichimoku indicator, plotted to the 1H timeframe from the 4H one. They provide trading signals;
Extreme levels are thin red lines from which the price bounced earlier. They provide trading signals;
Yellow lines are trend lines, trend channels, and any other technical patterns;
Indicator 1 on the COT charts is the net position size for each category of traders;
Indicator 2 on the COT charts is the net position size for the Non-commercial group.