Analyzing Thursday's trades:
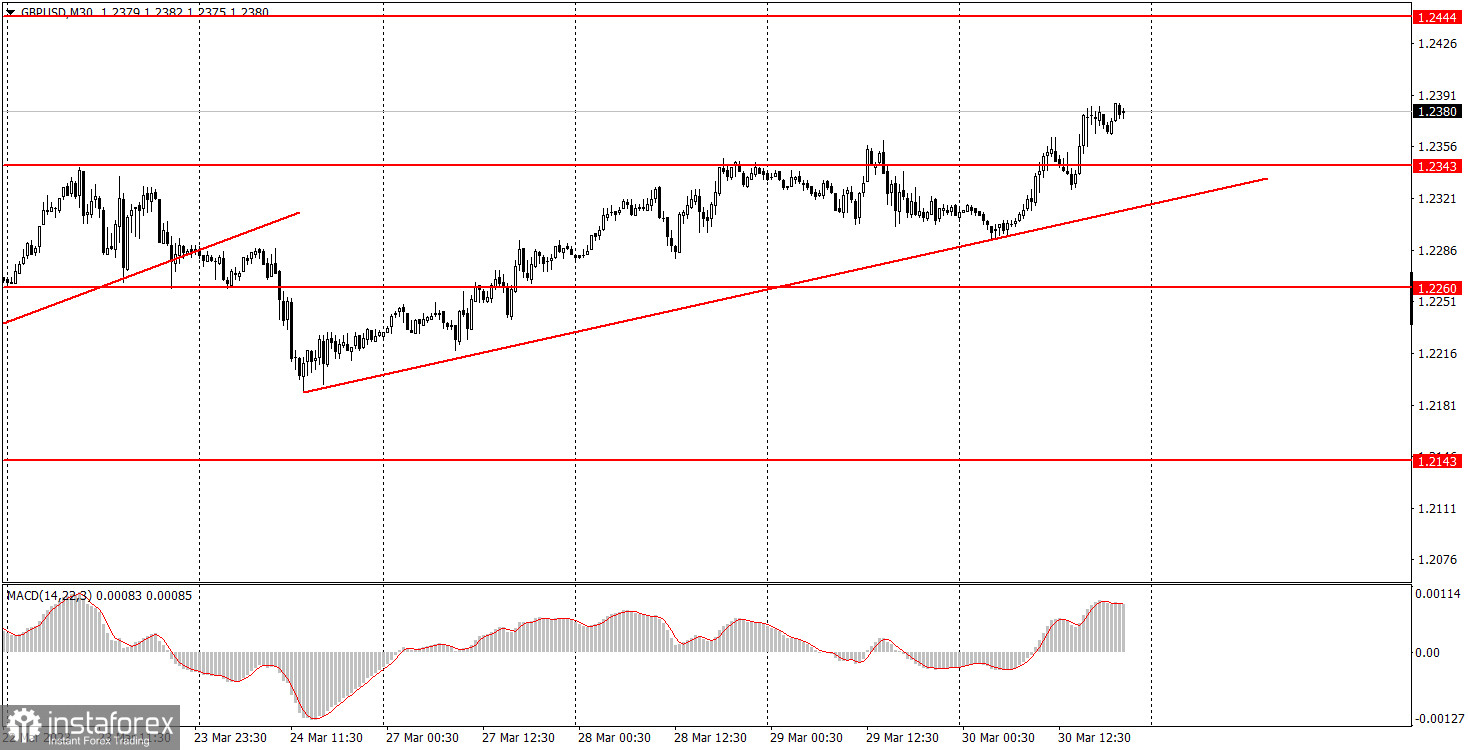
GBP/USD on 30M chart
On Thursday, GBP/USD also stretched its upward movement for no reason at all. The euro theoretically had the right to grow because of the inflation report, but then the same report had nothing to do with the pound. Maybe the euro pulled the pound up, like it often happens. But that is neither an explanation, nor an excuse. The pound also has not corrected normally, it has been growing for four straight days without any good reason, and if the euro and the pound keep pulling each other up, at such a rate there will never be a correction at all. A new uptrend line has been formed, which supports the bulls. Therefore, although we're waiting for the pound to fall, we shouldn't expect it to happen until GBP settles below the trend line. And as practice shows, even if the pound consolidates below the trend line there is still no guarantee.
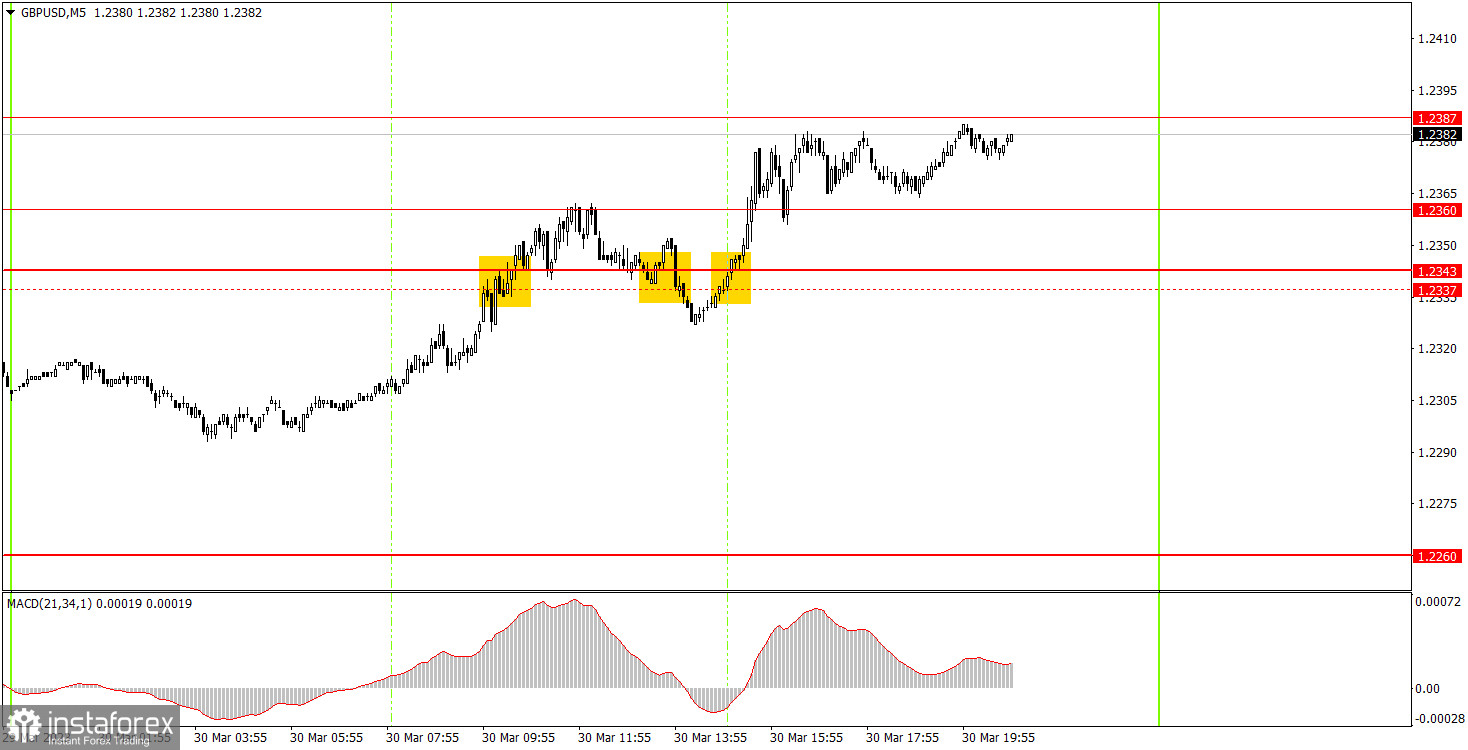
GBP/USD on 5M chart
Not the best trading signals on the 5-minute chart. The pair regularly fell, which prevented us from making profit. The 1.2360 level is a new one, and I removed 1.2337 from the charts by the end of the day. Thus, all the signals were formed near the area of 1.2337-1.2343, and the first two were definitely false. Beginners should not have used the third one. The pound failed to pass even 20 points in the right direction in both cases, so there was a small loss on both trades. As you can see, almost one-sided movement without corrections is not always good as well. The volatility of the pair was 75 pips on Thursday, but the pound passed most of them at night and in the early morning.
Trading tips on Friday:
On the 30-minute chart, GBP/USD continues to trade in the classic "swing", but in the long term. After several weeks of growth, we are still waiting for the pair to enter a bearish correction. But the market still refuses to open short positions regardless of the sell signals. On the 5-minute chart, it is recommended to trade at the levels 1.2065-1.2079, 1.2143, 1.2171-1.2179, 1.2245-1.2260, 1.2337-1.2343, 1.2387, 1.2444-1.2471, 1.2577-1.2616. As soon as the price passes 20 pips in the right direction, you should set a Stop Loss to breakeven. On Friday, the UK is set to publish its GDP report, which should remain unchanged for the fourth quarter. However, this report might not do any harm to the pound. In America, only minor data will be released, such as personal income and expenditures of the U.S. population and the index of consumer sentiment from the University of Michigan.
Basic rules of the trading system:
1) The strength of the signal is determined by the time it took the signal to form (a rebound or a breakout of the level). The quicker it is formed, the stronger the signal is.
2) If two or more positions were opened near a certain level based on a false signal (which did not trigger a Take Profit or test the nearest target level), then all subsequent signals at this level should be ignored.
3) When trading flat, a pair can form multiple false signals or not form them at all. In any case, it is better to stop trading at the first sign of a flat movement.
4) Trades should be opened in the period between the start of the European session and the middle of the US trading hours when all positions must be closed manually.
5) You can trade using signals from the MACD indicator on the 30-minute time frame only amid strong volatility and a clear trend that should be confirmed by a trendline or a trend channel.
6) If two levels are located too close to each other (from 5 to 15 pips), they should be considered support and resistance levels.
On the chart:
Support and Resistance levels are the levels that serve as targets when buying or selling the pair. You can place Take Profit near these levels.
Red lines are channels or trend lines that display the current trend and show in which direction it is better to trade now.
The MACD indicator (14, 22, and 3) consists of a histogram and a signal line. When they cross, this is a signal to enter the market. It is recommended to use this indicator in combination with trend patterns (channels and trendlines).
Important announcements and economic reports that can be found on the economic calendar can seriously influence the trajectory of a currency pair. Therefore, at the time of their release, we recommend trading as carefully as possible or exiting the market in order to avoid sharp price fluctuations.
Beginners on Forex should remember that not every single trade has to be profitable. The development of a clear strategy and money management is the key to success in trading over a long period of time.