empty
 
 
08.02.2023 05:21 AM
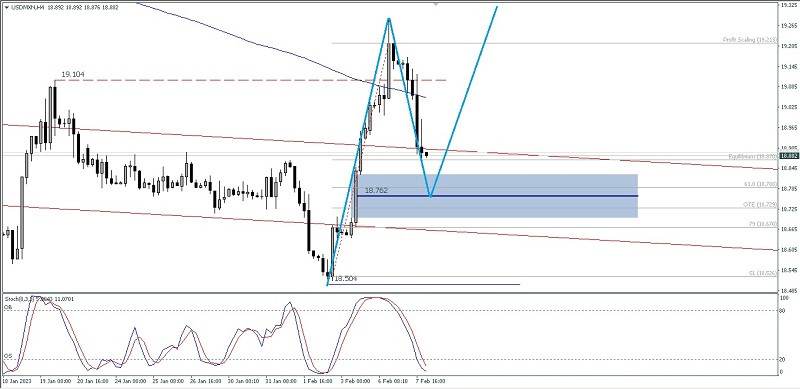
Technical Analysis of Intraday Price Movements of USD/MXN currency pairs, Wednesday 08 February 2023.

This image is no longer relevant

After succesfully break above the level 19,104 and after that USD/MXN currency pairs halted by the upward movement by the Dynamic Resistance (MA 200). Now USD/MXN is falling back down to test the 18,762 level. If this level is able to withstand the downward trend of USD/MXN, this currency pair has the potential to rise again if during a downward correction. there was no significant decline that passed below the 18,672 level where if this level was not broken then USD/MXN would have the potential to rally again up to the 19,213-19,398 area level as the first target and the 19,639-19,900 area level as the second target.

(Disclaimer)

USDMXN
US Dollar vs Mexican Peso
Select timeframe
5
min
15
min
30
min
1
hour
4
hours
1
day
1
week
Start trade
Start trade
  • Grand Choice
    Contest by
    InstaForex
    InstaForex always strives to help you
    fulfill your biggest dreams.
    JOIN CONTEST
  • Chancy Deposit
    Deposit your account with $3,000 and get $8000 more!
    In March we raffle $8000 within the Chancy Deposit campaign!
    Get a chance to win by depositing $3,000 to a trading account. Having fulfilled this condition, you become a campaign participant.
    JOIN CONTEST
  • Trade Wise, Win Device
    Top up your account with at least $500, sign up for the contest, and get a chance to win mobile devices.
    JOIN CONTEST
  • 100% Bonus
    Your unique opportunity to get a 100% bonus on your deposit
    GET BONUS
  • 55% Bonus
    Apply for a 55% bonus on your every deposit
    GET BONUS
  • 30% Bonus
    Receive a 30% bonus every time you top up your account
    GET BONUS

Recommended Stories

Technical analysis on EURUSD for March 31st, 2023.

EURUSD is trading around 1.0886. Price is under pressure today. Price has so far respected the key support neckline and cancelled the bearish Head and Shoulders pattern. At the same

Alexandros Yfantis 12:01 2023-03-31 UTC+2

Technical analysis on NZDUSD for March 31st, 2023.

NZDUSD is trading around 0.6260. Price recently tested the black neckline resistance for the 4th time and it seems it is getting rejected once again. In the near term price

Alexandros Yfantis 11:55 2023-03-31 UTC+2

Technical analysis on Gold for March 31st, 2023.

Gold price is trading around $1,979. Price remains inside the triangle pattern we mentioned in our previous analysis. Price has reached the short-term resistance level of $1,983 where we find

Alexandros Yfantis 11:52 2023-03-31 UTC+2

Forecast for EUR/USD on March 31, 2023

On Thursday, the EUR/USD pair resumed its upward trend and secured above the corrective level of 200% (1.0861). As a result, the European currency can now continue to rise toward

Samir Klishi 11:26 2023-03-31 UTC+2

Forex forecast 03/31/2023 EUR/USD, GBP/USD, GBP/JPY, Oil and Bitcoin from Sebastian Seliga

Let's take a look at the technical picture of EUR/USD, GBP/USD, GBP/JPY, Oil and Bitcoin

Sebastian Seliga 11:04 2023-03-31 UTC+2

Forecast for GBP/USD on March 31, 2023

The GBP/USD pair secured above the level of 1.2342 on Thursday, and the hourly chart shows that development is continuing toward the level of 1.2432. Let me tell you that

Samir Klishi 11:02 2023-03-31 UTC+2

GBP/USD: upside seems over

The GBP/USD pair is trading in the red at the time of writing and it seems very heavy, so more declines are in cards. After its amazing growth, a sell-off

Ralph Shedler 10:20 2023-03-31 UTC+2

Indicator analysis: Daily review of GBP/USD on March 31, 2023

The pound-dollar pair may move down from the level of 1.2382 (closing of yesterday's daily candle) to 1.2352, the 85.4% pullback level (blue dotted line). Upon reaching this level

Stefan Doll 09:55 2023-03-31 UTC+2

Video market update for March 31, 2023

Potential for the downside movement on Silver and BTCUSD

Petar Jacimovic 09:51 2023-03-31 UTC+2

Indicator analysis: Daily review of EUR/USD on March 31, 2023

The euro-dollar pair may move down from the level of 1.0904 (closing of yesterday's daily candle) to 1.0869, the 14.6% pullback level (yellow dotted line). When testing this level

Stefan Doll 09:45 2023-03-31 UTC+2
Can't speak right now?
Ask your question in the chat.