By the end of the last trading week, the Euro/Dollar currency pair showed volatility slightly below the average daily point of 53 points, as a result of which a pullback was formed. From the point of view of technical analysis, we see an interesting picture, and so, the ill-fated support in the form of a value of 1.0926 was locally broken but the inertial stroke at that moment subsided. This results in overheating of short positions and in fact, a rollback. I think it's too early to talk about 100% breakdown since the support of 1.0926 has transformed over time into a range level with approximate boundaries of 1.0900/1.0950.
As discussed in the previous review, speculators assumed the development of the plot in terms of rollback/stagnation, where the interaction points were just around the boundaries of the level of 1.0900/1.0950, but clear price fixations did not happen. Thus, entering the market was not made.
Considering the trading chart in general terms [the daily period], everything is much more interesting here. The global downtrend is on the verge of further development, where almost a month-long mixed stop played only for the benefit of the bears, who managed to strengthen their positions. In the case of coincidence of expectations, sellers can get new locations around the beginning of 2017.
Last Friday's news background contained data on orders for durable goods in the United States, where they were expected to decline by 1.1%, but as a result, it increased by 0.2%. In the case of the EURUSD pair, the statistics for the States did not affect the trading chart in any way.
In terms of informational background, we have statements by the chief economist of the European Central Bank, Philip Lane, regarding deposit rates.
"We saw lower negative rates in other regions, so I personally do not think that there is already a technical limit," said Philip Lane
And on Monday [September 30], the Financial Times published an interview with Mario Draghi, where the head of the regulator made it clear that the ECB was ready for anything.
"All instruments, from interest rates to asset purchases to forecast rates, are ready to calibrate," said Mario Draghi.
Returning to everyone's favorite Brexit divorce proceedings, we see Berlin's long-awaited response regarding a possible delay. So, the German government, unlike France, demonstrates its readiness to grant a deferment of Britain, of course, that is if England submits an appropriate request for an extension. However, German Foreign Minister Heiko Maas emphasized that an extension of the postponement period is only possible if there is a really good reason, such as a new election or a second referendum in the UK.

Today, in terms of the economic calendar, we have seen data from Europe on unemployment, where we expected a 7.5% rate to be maintained. But as a result, we have seen a slight yet still a decrease to 7.4%. The euro's response to statistics was virtually non-existent as the euro losing value in the minute it was published. At 12:00 UTC, preliminary data on inflation in Germany should be released, where they expect a decrease from 1.4% to 1.3% that may put pressure on the single currency again.
Further development
Analyzing the current trading chart, we see an attempt to return quotes to the limit of the pivot point of last Friday, that is, to the area of 1.0900. The oscillation that we are observing is very similar to the common pattern of "Breakout-Rollback", where they are waiting for some gain in the direction of the main move. At the same time, the theory of the existing range level of 1.0900/1.0950 is still confidently held in the minds of traders.
In turn, speculators are closely monitoring the behavior of quotes relative to existing boundaries at 1.0900/1.0950 since breakdown will bring a new round of fluctuations.
It is likely to that the amplitude fluctuation of 1.0900/1.0950 will persist for some time, where you can closely monitor fixing points outside the previously established boundaries. In case that the expectations of traders and breakdown coincide as the fact of the lower border, we are waiting for the further formation of the initial trend towards the subsequent level of 1.0850 (1.0800).
Based on the above information, we derive trading recommendations:
- We consider the buy positions in terms of rebound and fixing of the price higher than 1.0950 with the prospect of a move towards the level of 1.1000.
- Sell positions are considered in terms of restoring the initial trend and fixing the price lower than 1.0900. In this case, the target is in the region of 1.0850-1.0800.
As we can see, the recommendations remain in the same plan, we closely monitor the borders as holding quotes in this area is expected to be short-lived.
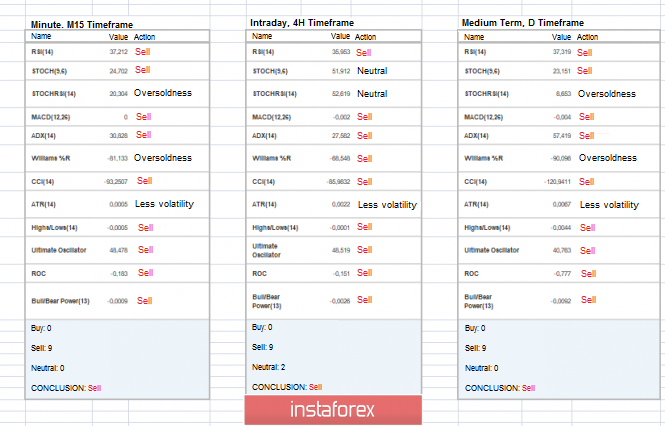
Indicator analysis
Analyzing a different sector of timeframes (TF), we see that the indicators on all major time sections unanimously signal a further downward trend. It is worth taking into account that if amplitude fluctuations within the previously designated boundaries, indicators at minute intervals can become variable.
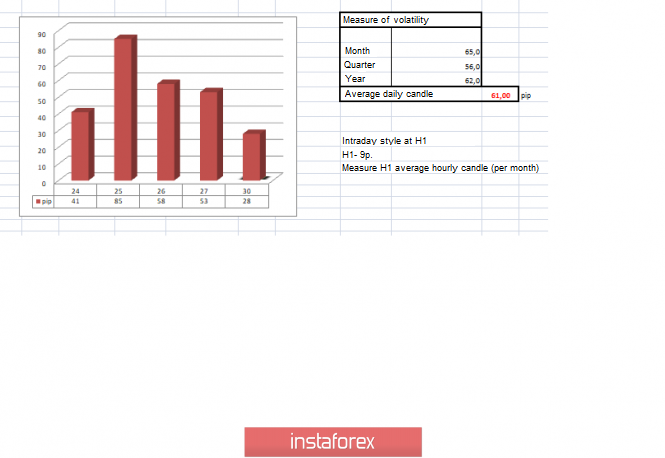
Volatility per week / Measurement of volatility: Month; Quarter; Year
Measurement of volatility reflects the average daily fluctuation, calculated for the Month / Quarter / Year.
(September 30 was built taking into account the time of publication of the article)
The current time volatility is 28 points, which is a low indicator for this timeframe. It is likely that in the event of a breakdown of one or another border [1.0900/1.0950] of the range level, volatility can significantly increase.
Key levels
Resistance zones: 1.0926 ** 1.1000 ***; 1,1100 **; 1,1180 *; 1.1300 **; 1.1450; 1.1550; 1.1650 *; 1.1720 **; 1.1850 **; 1,2100
Support areas: 1.0926 **; 1.0850 **; 1,0500 ***; 1.0350 **; 1,0000 ***.
* Periodic level
** Range Level
*** Psychological level
**** The article is built on the principle of conducting a transaction, with daily adjustment