empty
 
 
25.11.2021 03:11 PM
EURUSD: The time of the reversal is close.

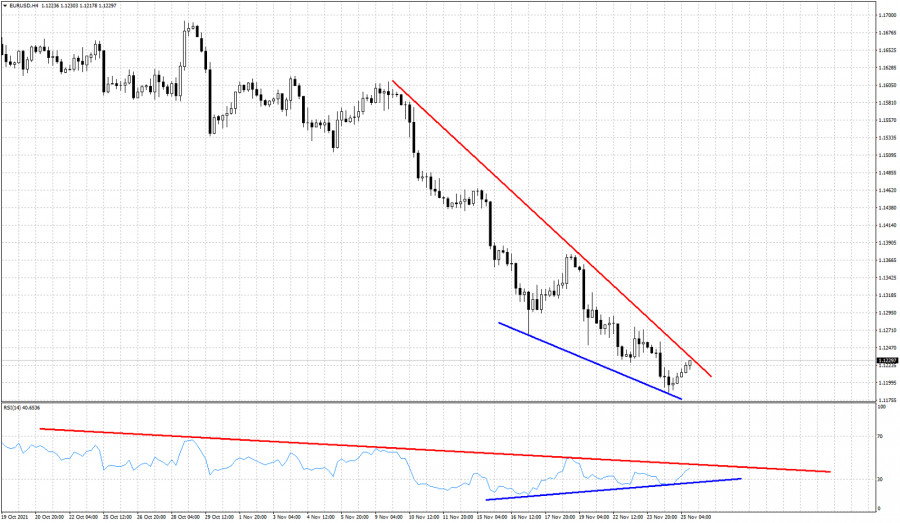
EURUSD continues to trade in a bearish trend making lower lows and lower highs. Price is clear regarding the trend, but the RSI is also clear in pointing out that the downtrend is weakening. Price is inside the downward sloping wedge pattern and over the next few sessions I expect a major reversal.

This image is no longer relevant

Red line -resistance

Blue lines - bullish divergence

EURUSD remains in a bearish trend as long as price is below the red trend line resistance and below 1.1276. Bulls need at least to break the red trend line to the upside in order to squeeze the bears and start hitting stops. Until then I will not be surprised if EURUSD gets rejected today at the resistance trend line and provides a new lower low. Overall price has reached our target area of 1.12-1.13 after our bearish signal at 1.1535 but now I prefer to be neutral if not slightly bullish.

EURUSD
Euro vs US Dollar
Select timeframe
5
min
15
min
30
min
1
hour
4
hours
1
day
1
week
Start trade
Start trade
  • Grand Choice
    Contest by
    InstaForex
    InstaForex always strives to help you
    fulfill your biggest dreams.
    JOIN CONTEST
  • Chancy Deposit
    Deposit your account with $3,000 and get $8000 more!
    In March we raffle $8000 within the Chancy Deposit campaign!
    Get a chance to win by depositing $3,000 to a trading account. Having fulfilled this condition, you become a campaign participant.
    JOIN CONTEST
  • Trade Wise, Win Device
    Top up your account with at least $500, sign up for the contest, and get a chance to win mobile devices.
    JOIN CONTEST
  • 100% Bonus
    Your unique opportunity to get a 100% bonus on your deposit
    GET BONUS
  • 55% Bonus
    Apply for a 55% bonus on your every deposit
    GET BONUS
  • 30% Bonus
    Receive a 30% bonus every time you top up your account
    GET BONUS

Recommended Stories

Technical analysis of GBP/USD for March 20, 2023

The GBP/USD pair traded higher and closed the day in the positive territory near the price of 1.2208. Right now, it was trading in a narrow range of 1.2150 staying

Mourad El Keddani 13:04 2023-03-20 UTC+2

Forex forecast 03/20/2023 EUR/USD, USD/JPY, GBP/USD, Gold and Bitcoin from Sebastian Seliga

Let's take a look at the technical picture of EUR/USD, USD/JPY, GBP/USD, Gold and Bitcoin

Sebastian Seliga 12:48 2023-03-20 UTC+2

Technical analysis of EUR/USD for March 20, 2023

The EUR/USD pair rallied upwards strongly yesterday to breach the bearish channel's resistance and settles above it, opening the way to turn to the upside on the intraday and short-term

Mourad El Keddani 12:21 2023-03-20 UTC+2

Video market update for March 20, 2023

Potential for rally on USD/CHF

Petar Jacimovic 12:06 2023-03-20 UTC+2

NZDUSD, H4 | Potential Bearish Reversal

The NZD/USD chart currently displays a bearish momentum, with price below a major descending trend line and the bearish Ichimoku cloud. The potential price movement could involve a bearish reaction

Dean Leo 09:46 2023-03-20 UTC+2

XAUUSD, Day | Potential Bearish Reversal from?

Gold prices have been experiencing a bearish trend for some time now, which is reinforced by a major descending trend line on the XAU/USD chart. The current price could potentially

Dean Leo 09:45 2023-03-20 UTC+2

Analysis of Gold for March 20,.2023 - Extreme bullish condiiton, potential for the further upside movement

Technical analysis: Gold has been trading upside this morning and I found that Gold is the very strong upside momentum and there is the chance for the multi year highs

Petar Jacimovic 09:25 2023-03-20 UTC+2

USD/CHF analysis for March 20, 2023 - Breakout of the triangle pattern to the upside

Technical analysis: USD/CHF has been trading upside this morning and I found the breakout of the triangle pattern in the background. Due to the breakout of the tight triangle

Petar Jacimovic 09:18 2023-03-20 UTC+2

Indicator analysis: Daily review of GBP/USD on March 20, 2023

The pound-dollar pair may move upward from the level of 1.2176 (closing of Friday's daily candle) to 1.2273, the 76.4% pullback level (blue dotted line). Upon reaching this level

Stefan Doll 09:17 2023-03-20 UTC+2

Indicator analysis: Daily review of EUR/USD on March 20, 2023

The euro-dollar pair may move upward from the level of 1.0666 (closing of Friday's daily candle) to 1.0713, the 38.2% pullback level (red dotted line). When testing this level

Stefan Doll 09:05 2023-03-20 UTC+2
Can't speak right now?
Ask your question in the chat.