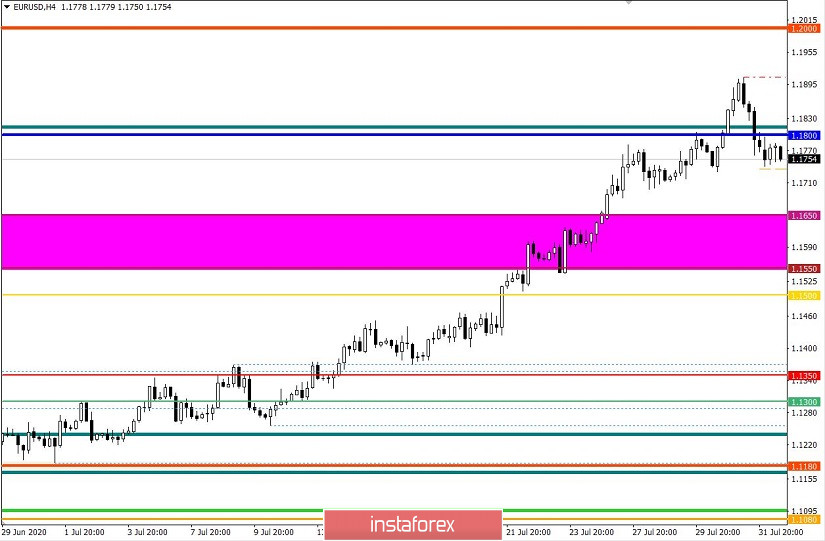
July has now ended. If we analyze all the trades that occurred that month, we will see that more than 700 points was taken during an upward move, in the structure of which there was no correction, and the slope of the chart reached 84 degrees. In addition, the yearly high which is the price level of 1.1496 (03/09/20) fell without too much effort, and the local highs were updated literally on a daily basis, as a result of which the quote practically reached the psychological level of 1.2000 (1.1908).
Hence, the US dollar became oversold, and the constant change of quotes led to an unstable growth, mainly due to the speculative mood of market participants.
So on the last day of July, the quote reached the price level of 1.1908 and then sharply changed direction, eventually going down to the level of 1.1750.
Such a movement can be considered a correction, but the scale is quite different than expected.
If we calculate the rate of price change in July and the absence of regrouping of trading forces, the correction may well reach 35%, and even 45% of the entire upward move.
Anyhow, analyzing the trades last Friday by minutes, we can see that a round of short positions appeared at the beginning of the European session and lasted until the closing of the trading day.
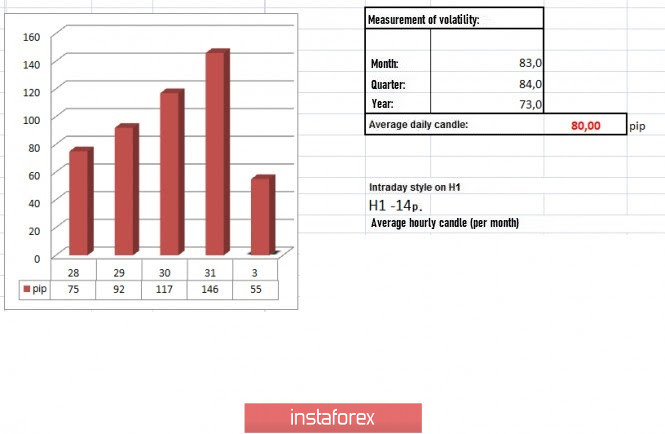
Such resulted in a volatility of 146 points, which is 82% higher than the average daily value. This suggests that activity over the past week was consistently high, which confirmed the presence of speculators on the market.
If we examine the dynamics of volatility in July, we can see that the average daily value is 86 points, which is 7.5% higher than the average value.
JULY: Wednesday - 90 points; Thursday - 79 points; Friday - 33 points; Monday - 104 points; Tuesday - 73 points; Wednesday - 89 points; Thursday - 90 points; Friday - 69 points; Monday - 73 points; Tuesday - 83 points; Wednesday - 61 points; Thursday - 71 points; Friday - 67 points; Monday - 65 points; Tuesday - 116 points; Wednesday - 93 points; Thursday - 86 points; Friday - 76 points; Monday - 140 points; Tuesday - 75 points; Wednesday - 92 points; Thursday - 117 points; Friday - 146 points.
The dynamics since the beginning of the year is 88 points (average daily value), which once again confirms the presence of speculators in the market.
As discussed in the previous review , traders were anticipating the correction, so short positions were opened below the level of 1.1850.
Looking at the trading chart in general terms (daily period), we can see that the quote returned to the price level it had on the fall of 2018.
With regards to news, the reports published last Friday included the first estimate on the EU GDP for the second quarter, in which it seems that a time machine was triggered and threw the EU economy back 10-20 years.
This means that data on GDP came out worse than forecasted, with which the quarterly indicator shrank by 12.1%, and the annual indicator contracted by -15.0%.
Such figures indicate that the German economy has returned to the level it had in 2011, Spain in 2002 and Italy in 1990.
Just as what European Commissioner for Economic Affairs Paolo Gentolini emphasized, the coronavirus pandemic has unprecedented consequences for all European countries.
Thus, demand for the European currency decreased, which is very justified with such weak data.
Today, the final data on the Euro area's Manufacturing PMI was published, in which the index came out even better than the forecast of 51.8 points, which could locally stop the depreciation of the euro.
Later in the afternoon, a similar PMI will be published, but this time for the United States. The index is forecast to rise from 49.8 to 51.3 points, and possibly higher.
If the US PMI comes out better than the forecast, the dollar may receive support and continue to rise in the market.
US 15:00 - Manufacturing PMI for July
Further development
Analyzing the current trading chart, we can see a fluctuation within the values 1.1740 / 1.1780, which, although temporary, can serve as a platform for further jumps in the market.
Assuming that the correction has not reached the required scale yet, a consolidation of quotes below 1.1740 can lead to the resumption of a decline, which will be a consistent descent of the price to the values 1.1715-1.1650.
But an alternative scenario could develop, if the market follows the speculative mood of traders, which disregards the characteristic oversold of the US dollar. In such a case, a consolidation higher than 1.1800 could bring the quote back to the values 1.1850-1.1900.
Indicator analysis
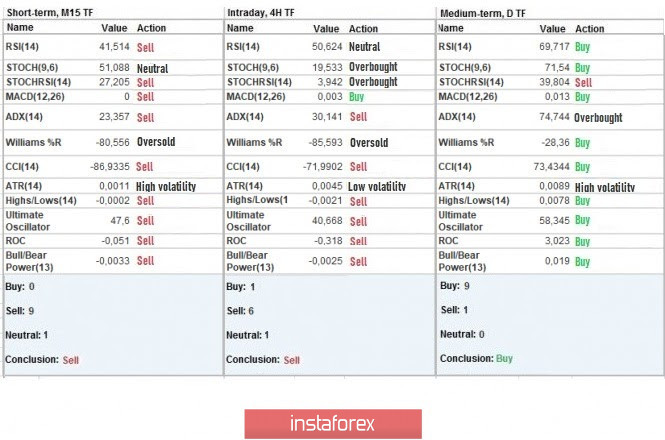
Analyzing the different sectors of time frames (TF), we can see that the indicators of technical instruments in the minute and hourly periods signal "sell" due to the correction of quotes, while the daily period, as before, signals "buy", reflecting the full scale of the movement.
Weekly volatility / Volatility measurement: Month; Quarter; Year
The measurement of volatility reflects the average daily fluctuation, calculated per Month / Quarter / Year.
(August 3 was built, taking into account the time the article is published)
Volatility is currently 55 points, which is 31% below the average daily value.
It is assumed that if the quote undergoes a correction, activity may increase in the market.
Key levels
Resistance zones: 1,1800 **; 1.2000 ***; 1.2100 *; 1.2450 **.
Support Zones: 1.1650 *; 1.1500; 1.1350; 1.1250 *; 1.1.180 **; 1.1080; 1.1000 ***; 1.0850 **; 1.0775 *; 1.0650 (1.0636); 1.0500 ***; 1.0350 **; 1.0000 ***.
* Periodic level
** Range level
*** Psychological level
Also check the trading recommendation for the GBP / USD pair here .