H4 time frame
Technical data:
Upper channel line - downtrend
Lower channel line - downtrend
Moving average (20-day period, smoothed) - downtrend
On Monday, GBP/USD was traded in line with market expectations. GBP's dynamics at the end of the previous week startled the market. The Bank of England took a hawkish stance on monetary policy during its recent meeting. However, the pound turned out to be affected by wrong and unreasonable expectations of market participants about its outcome. It remains unclear why they expected the regulator to increase the interest rate by 0.15%. Inflation in the UK is not the highest compared to other countries – just 3.1%. For instance, inflation is at the rate of above 4% in the eurozone and over 5% in the US. Therefore, there were no reasons for the British regulator to take action. Of course, prices are rising in the UK as they do in other countries but at a slower pace than in the US. Moreover, the US Federal Reserve does not even plan rate hikes any time soon. Then, why should the BoE do it? Therefore, it seems that fake news was spread to make the pound plummet. It is hard to tell who benefited from it in the first place! It could be major players in the foreign exchange market or the BoE that needs a weaker pound. The point is that GBP tumbled by almost 300 pips when it should have soared. On Monday, however, the pound strengthened. The currency is expected to extend its rally to the levels it fell from in the previous week.
The Bank of England, unlike the Fed, is preparing for monetary policy tightening. Apart from that, GBP has received additional support after the previous week. Many experts, traders, and investors are seriously considering the possibility of rate hikes by the BoE during the December meeting. If so, the regulator will be a step ahead of the Fed in terms of monetary policy tightening, which is a rare occasion. Therefore, the pound is likely to encounter additional support from the market dispute other difficulties the UK is currently going through, icluding Brexit-related issues, Scotland's independence movement, and supply chain shortages. Nevertheless, all these problems have had no impact on the sterling. Of course, the pound, as well as the euro, has declined versus the dollar over the past 8 months, but this movement is just a correction against the global upward trend.
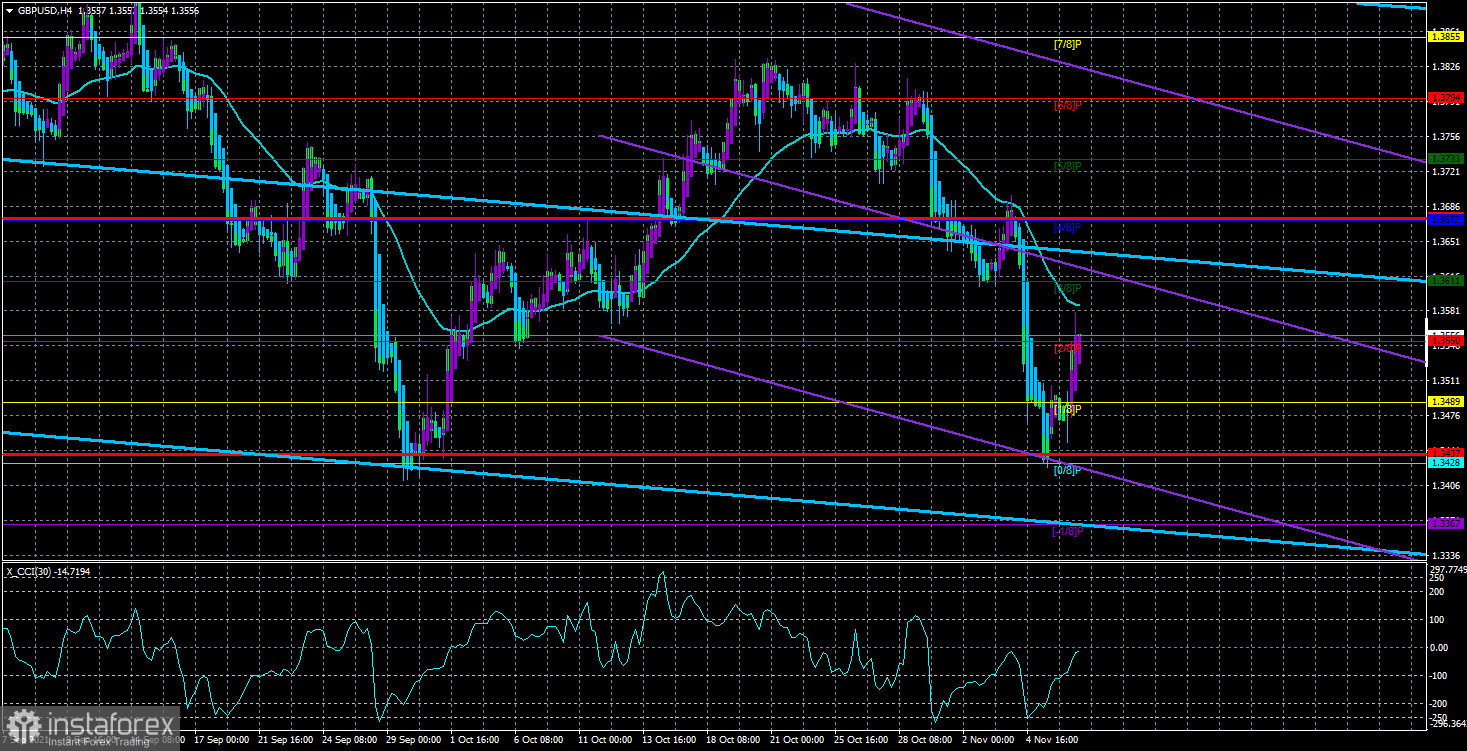
The pound's direction this week remains unclear. Several reports are set to come out in the UK but there is a 90% chance that they will be ignored by traders. The inflation rate will be the only important data released in the US. Consequently, trading is likely to be based on signals from technical indicators. As a reminder, the price touched and bounced from the Murray level 0/8 (1.3428) twice. That is why a double bottom pattern could form. In case the price breaks above the MA, the upward movement is likely to extend. Based on the 24H Ichimoku time frame, the euro/dollar pair has a growth potential of 500 pips.
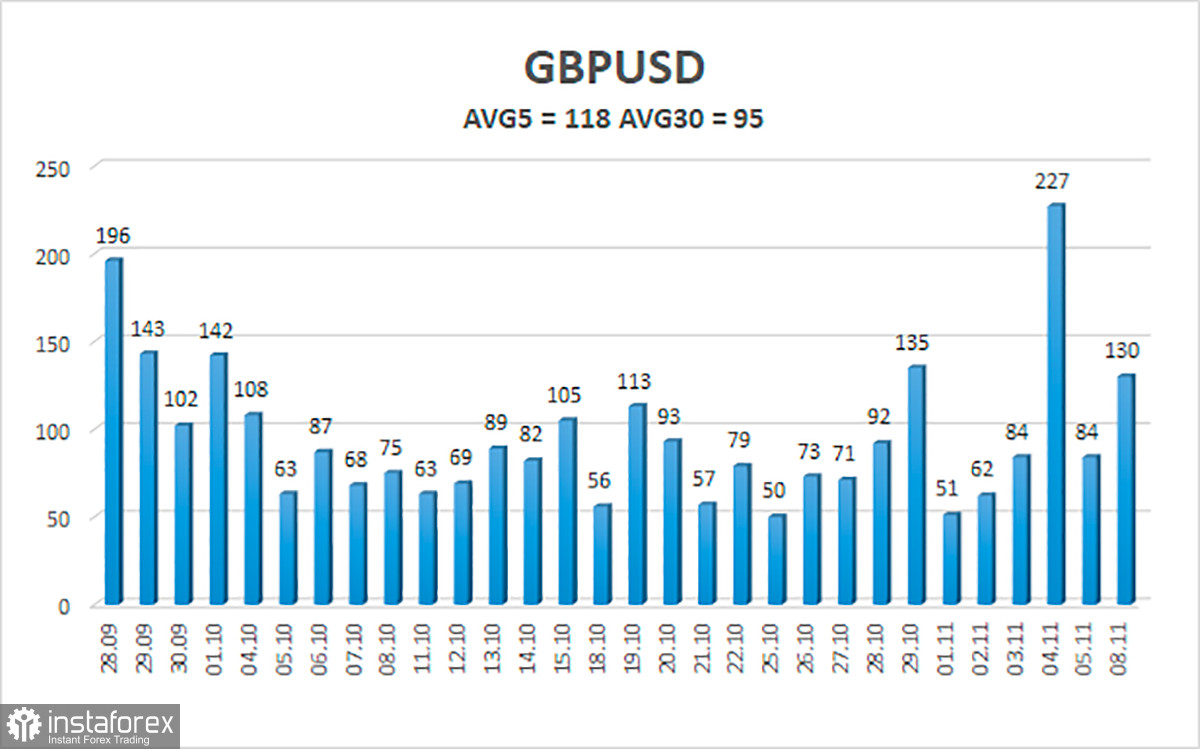
On November 9, GBP/USD average daily volatility is 118 pips. Today, the pair is expected to move in the range of 1.3437/1.3674. Heiken Ashi's reversal will indicate a downtrend.
Closest support levels
S1 – 1.3489
S2 – 1.3428
S3 – 1.3367
Closest resistance levels
R1 – 1.3550
R2 – 1.3611
R3 – 1.3672
Outlook:
On the H4 time frame, GBP/USD is located below the MA, indicating a downtrend. Against this backdrop, short positions could be considered if the price bounces from the MA with the targets at 1.3489 and 1.3437. Meanwhile, long positions could be opened in case of consolidation above the MA with the targets at 1.3672 and 1.3733 until Heiken Ashi reverses.
Indicator Description:
Linear Regression Channels help identify the current trend. If both channels move in the same direction, the trend is strong.
Moving Average (20-day, smoothed) - defines a short-term and the current trend.
Murray levels are target levels for trends and corrections.
Volatility levels (red lines) reflect a possible price channel the pair is likely to trade the next day based on the current volatility indicators.
CCI indicator: when the indicator is in the oversold area (below 250) or in the overbought area (above 250), it means that a trend reversal is likely to occur soon.