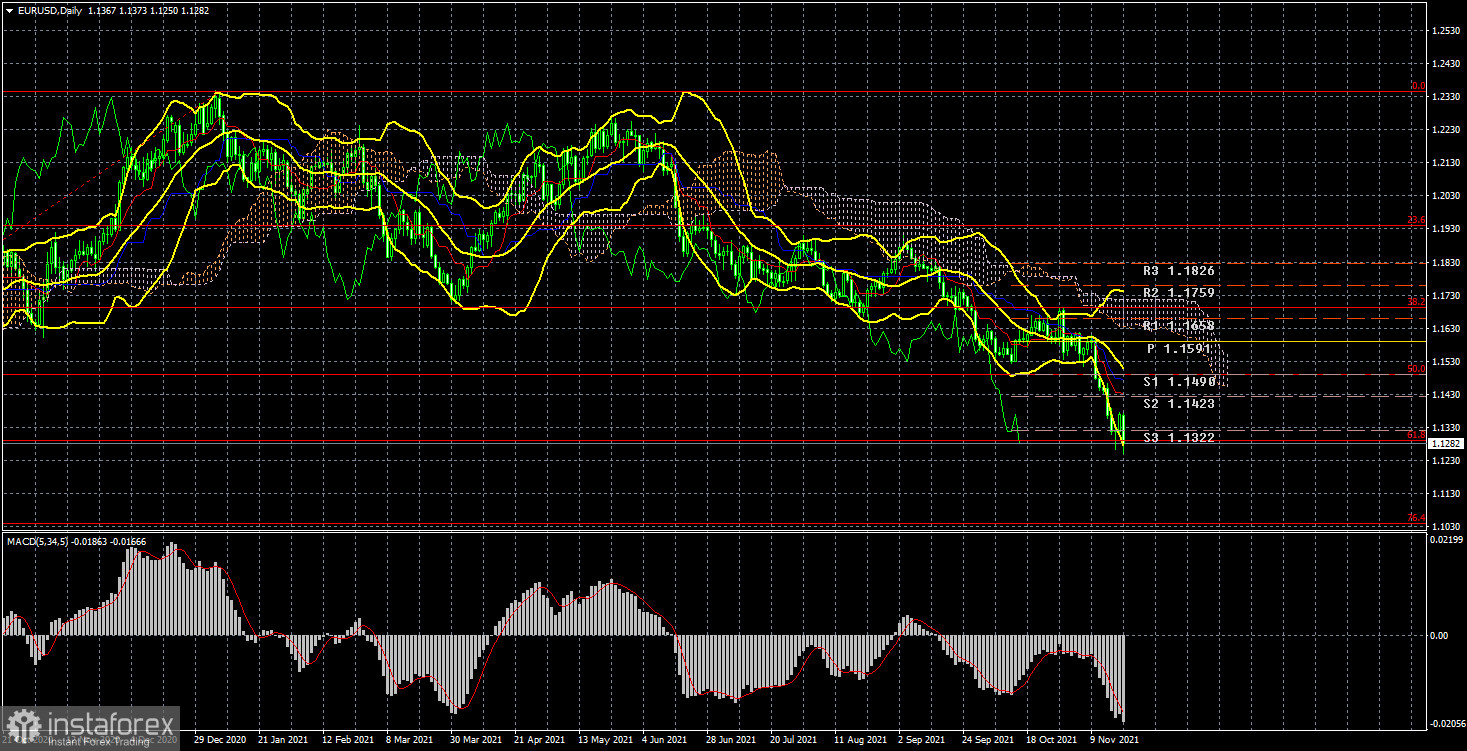
EUR/USD 24-hour TF analysis.
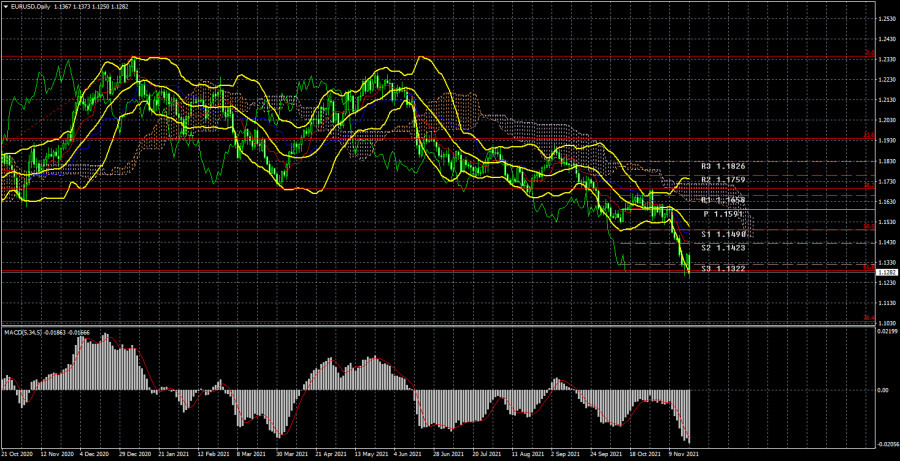
The EUR/USD currency pair has fallen by another 160 points during the current week. Thus, the downward movement continues and it continues as a whole throughout 2021 - for almost 11 months. During this time, the pair's quotes have managed to fall to the Fibonacci level of 61.8%, and, from our point of view, now is the last chance for the pair to keep the global upward trend in force. We remind traders that the euro has been growing for almost the whole of 2020, and the 61.8% Fibonacci level is 61.8% of the total growth for 2020. Thus, formally, the entire movement of 2021 is a correction. However, it should be recognized that over the past few weeks, this correction has become less and less like a correction. Near the 38.2% Fibonacci level, we expected that the strengthening of the US currency would end. However, the markets considered that the high probability of tightening monetary policy in the United States is a good reason to continue buying the dollar. They are partly right since the ECB has been making it clear for several months in a row that it will not raise the rate next year. Christine Lagarde has stated this several times just this week. Therefore, an imbalance has formed between the expected monetary policies of the ECB and the Fed in 2022. And this imbalance is clearly in favor of the American currency. In addition, the European Union is being covered by a new wave of "coronavirus". A month ago, we wrote that several European countries are introducing a new quarantine, and yesterday it became known that from next Monday a lockdown will be introduced in Austria. Moreover, all unvaccinated citizens will be prohibited from leaving the house, and from February 1 next year vaccination will be mandatory for everyone. Thus, the US dollar may also grow against the background of growing fears for the epidemiological situation in the European Union, as well as for the future state of its economy. If other EU countries also begin to close for quarantine, then a new economic decline cannot be avoided.
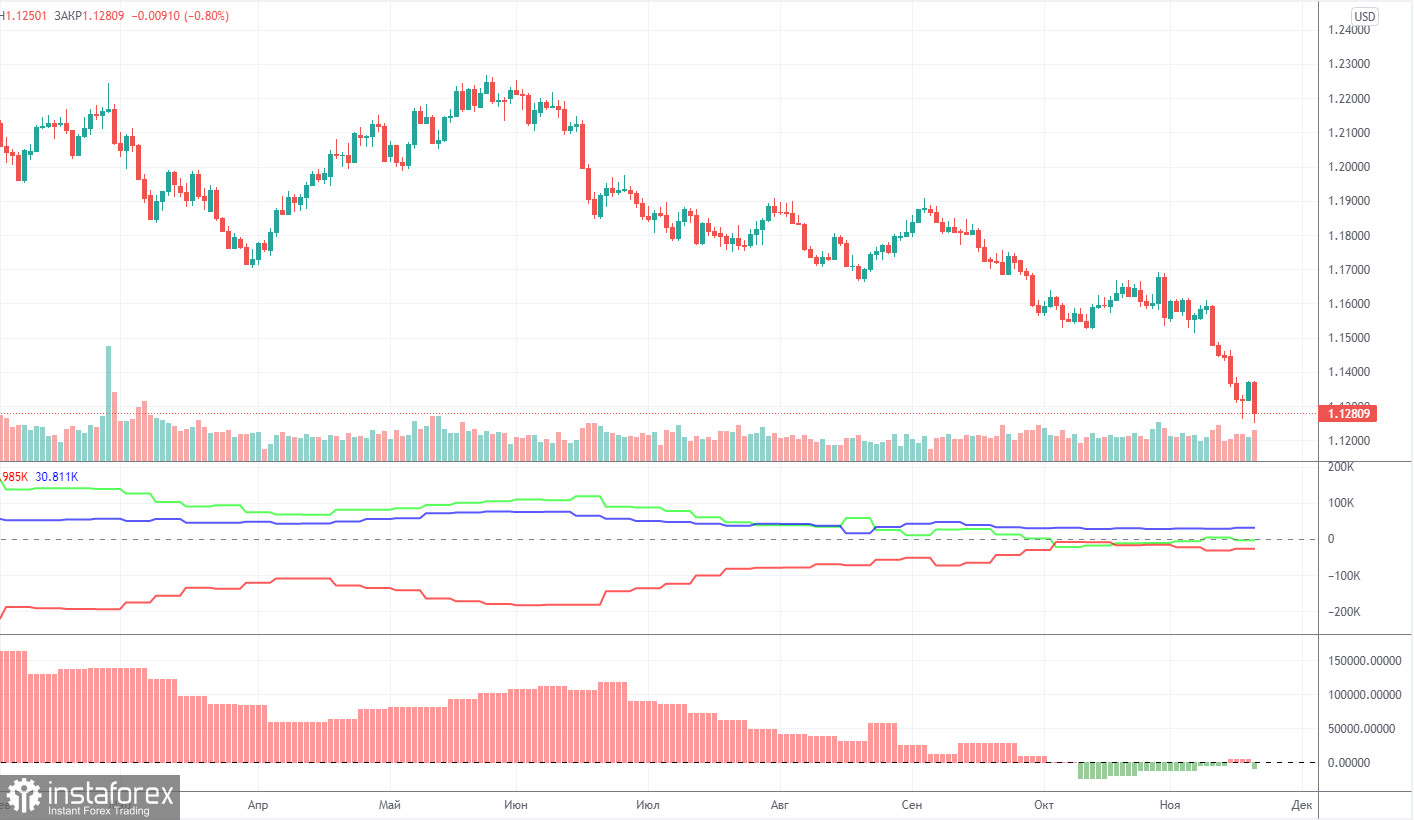
Analysis of the COT report.
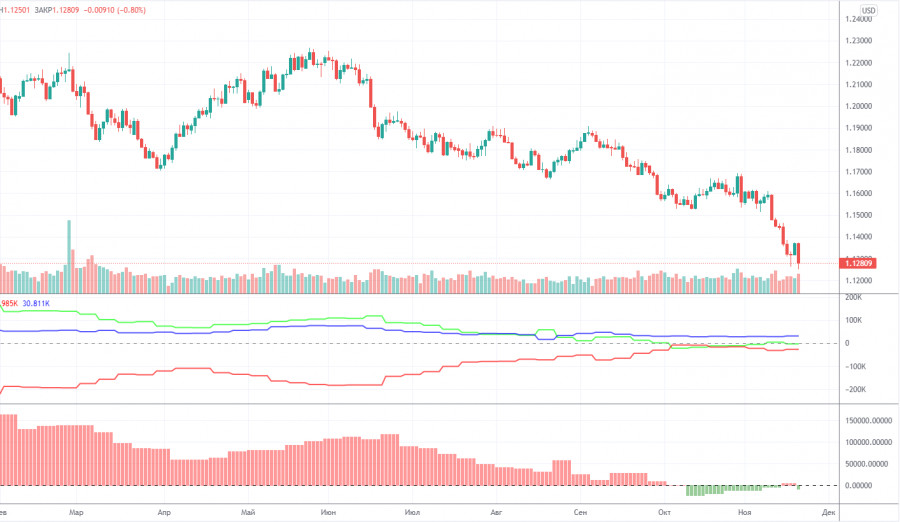
During the last reporting week (November 15-19), the mood of non-commercial traders has changed quite a lot. A group of "Non-commercial" traders opened 7 thousand contracts for purchase and 20.5 thousand contracts for sale during the week. Thus, the net position for professional traders decreased by 13.5 thousand, and the mood became more "bearish". It should be noted that the European currency has fallen quite seriously in the last few weeks. But the net position for the "Non-commercial" group, starting from October, practically does not change. This is indicated by the green line of the first indicator in the illustration above. Almost all this time it has been near the zero level, indicating the absence of serious changes in the mood of major players. Thus, if the general trend remains the same – over the past 10 months, major players have seriously reduced the number of longs and increased the number of shorts, then nothing like this has been observed in the last few weeks, and the European currency has been falling anyway. This suggests that what is happening on the market now does not quite correspond to the actions of major players. The second indicator (a net position for professional traders in the form of a histogram) shows at all that in the last 6 weeks the mood of traders has become less "bearish". In theory, at this time, the euro currency should have been growing, not falling. Thus, if we conclude only from COT reports, then the further fall of the euro currency is completely unobvious.
Analysis of fundamental events.
The current week has been as boring as possible in terms of macroeconomic and fundamental events. It can be safely called the "Christine Lagarde week", as she managed to speak 6 times. And in most cases, she repeated the same thing: there are no plans to raise rates in 2022, and high inflation is temporary. Naturally, the euro did not receive market support on such rhetoric of the ECB chairman. There is nothing to highlight from the reports at all. During the week, data on GDP and inflation in the European Union were published. At first glance, these are very important reports, but at second glance, these are not the first estimates of indicators for the reporting period. Thus, the markets have long known what the values would be and did not react to this data in any way. And it turns out that the whole current week was not so important in terms of the "foundation" and "macroeconomics". Nevertheless, the euro currency showed a strong drop, which again raises some questions.
Trading plan for the week of November 22-26:
1) On the 24-hour timeframe, the trend remains downward. At the moment, the quotes remain below the Kijun-sen line, and the markets have shown that they are not ready to buy the pair. Thus, the downward movement may continue with the target of 1.1038. This option will be appropriate if the pair overcomes the 61.8% Fibonacci level. The fundamental background currently supports the further fall of the euro and the growth of the dollar.
2) As for purchases of the euro/dollar pair, in the current conditions, they should be considered no earlier than fixing the price above the critical line. And ideally - above the Ichimoku cloud, because the price has already overcome the Kijun-sen several times, but then could not continue moving up. There are a few prerequisites for a new uptrend to begin in the near future. First of all, technical.
Explanations to the illustrations:
Price levels of support and resistance (resistance /support), Fibonacci levels - target levels when opening purchases or sales. Take Profit levels can be placed near them.
Ichimoku indicators(standard settings), Bollinger Bands(standard settings), MACD(5, 34, 5).
Indicator 1 on the COT charts - the net position size of each category of traders.
Indicator 2 on the COT charts - the net position size for the "Non-commercial" group.