GBP/USD 5M
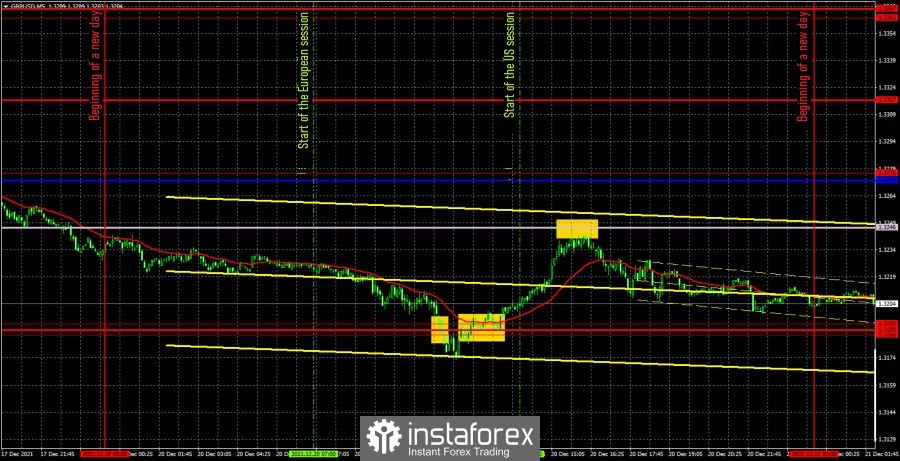
The GBP/USD pair also traded quite well on Monday. This means that the pair did not stand in one place, although it could have done so, since there was not a single important event or news in the UK today. It's the same in the United States. However, the nature of the pound's movement was slightly different from the nature of the euro's movement. In the first half of the day, the British currency continued to fall against the dollar, as if returning it a favor after a rather strong growth at the end of last week. That is, the euro pushed off the lower border of the horizontal channel at night, and the pound did only in the middle of the European session. Therefore, an upward movement also began inside the 1.3170-1.3276 horizontal channel in the afternoon. Yes, the pound has also been trading in a horizontal channel in recent weeks, although this is not as obvious as in the case of the euro. The fact is that last week, after the Bank of England raised its key rate, the markets rushed to buy up the pound, but on Friday they realized the futility of these actions and the pound very quickly slipped back to annual lows. Thus, we can only consider the trading signals on Monday. Unfortunately, it did not start the day well, because initially at the 5-minute TF the quotes settled below the support area of 1.3186-1.3193, which should have been interpreted as a sell signal. Thus, short positions should have been opened here, which reversed very quickly as the price returned to the area above 1.3193. The loss on the first trade was 16 points. There and then it was necessary to work out the signal to buy with a long position. The price subsequently increased to the Senkou Span B line, not reaching it by only 2 points. However, this is a small margin of error for the pound, so a long position could still be manually closed. The profit was 37 points. Also, this "undershoot" should be interpreted as a signal to sell and open new short positions. Until the evening, the price did not manage to drop to the level of 1.3193, so this deal should also be closed manually at a profit of about 15 points. Thus, in total yesterday we managed to earn about 35 points.
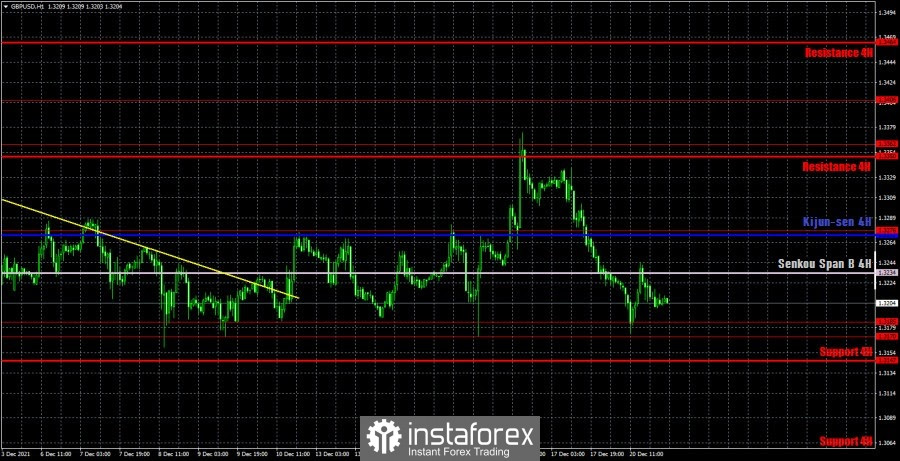
GBP/USD 1H

On the hourly timeframe, the pound/dollar pair dropped to the lower border of the horizontal channel and rebounded from it. Therefore, logically, and given the festive status of the last two weeks of the outgoing year, we can expect that quotes will remain within this channel. However, if the price still goes below 1.3170, then it will be possible to expect that by the end of 2021, the pound will renew its anti-record value against the dollar. We distinguish the following important levels on December 21: 1.3170-1.3185, 1.3276, 1.3362. There are no levels below, since the price has not been so low for over a year. Senkou Span B (1.3234) and Kijun-sen (1.3272) lines can also be signal sources, but these lines lose their strength in flat conditions. Signals can be "rebounds" and "breakthroughs" of these levels and lines. It is recommended to set the Stop Loss level at breakeven when the price passes 20 points in the right direction. The Ichimoku indicator lines can move during the day, which should be taken into account when looking for trading signals. Neither the UK nor the US will again have a single interesting event or report on Tuesday. Thus, the volatility is likely to be low again. And the fact that Christmas week has begun increases the likelihood that the horizontal channel will remain.
We recommend you to familiarize yourself:
Overview of the EUR/USD pair. December 21. The European Central Bank did not provide any support for the euro currency.
Overview of the GBP/USD pair. December 21. The epidemiological situation in the United Kingdom and the United States is deteriorating.
Forecast and trading signals for EUR/USD for December 21. Detailed analysis of the movement of the pair and trade deals.
COT report

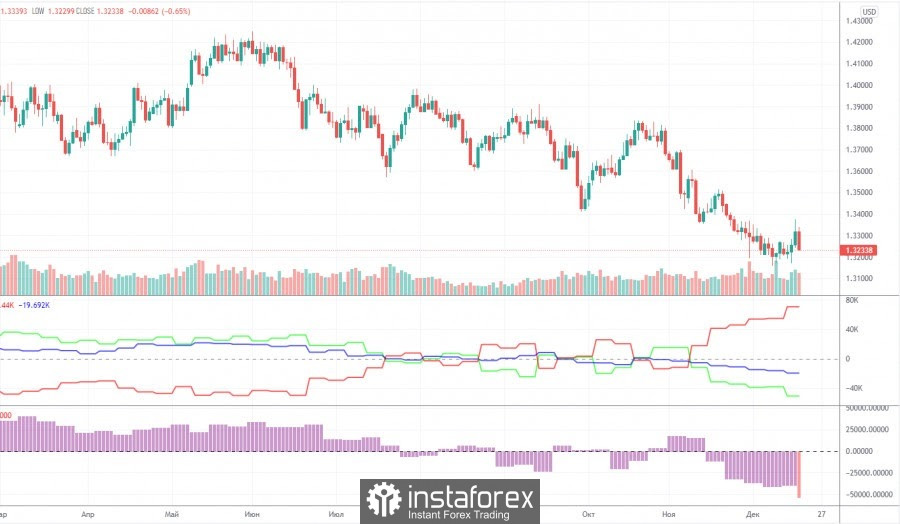
The mood of commercial traders was much more bearish during the last reporting week (December 7-13). Commercial traders closed 6,700 sell contracts (shorts) and 20,100 buy contracts (longs) during the week. Thus, the net position for the "non-commercial" group of traders decreased by 13,400 contracts, which is a lot for the pound. Thus, unlike the euro currency, the pound, according to COT reports, continues to fall quite reasonably: major players continue to sell it. However, the green and red lines of the first indicator (which mean the net positions of the non-commercial and commercial groups) have already moved far away from each other. Recall that such a deletion signals the imminent end of the trend. However, as with any fundamental assumptions, specific technical signals are required to work out this hypothesis, which are not currently available. If we do not take into account the increase in the key rate by the Bank of England, then there are no special fundamental reasons for the growth of the pound now either. Recall that Prime Minister Boris Johnson continues to get into various scandals in Great Britain and there is already talk that he will leave his post before the end of the deadline. The pandemic in the UK is gaining momentum and the other day an anti-record was set for the daily number of infections. Omicron is also spreading quite rapidly across the country, creating additional risks for the healthcare system and the economy. London, on the other hand, cannot find a common language with Paris and Brussels, which threatens it with the deterioration of relations with its closest neighbors and the loss of markets for the sale of products. But there is no positive news.
Explanations for the chart:
Support and Resistance Levels are the levels that serve as targets when buying or selling the pair. You can place Take Profit near these levels.
Kijun-sen and Senkou Span B lines are lines of the Ichimoku indicator transferred to the hourly timeframe from the 4-hour one.
Support and resistance areas are areas from which the price has repeatedly rebounded off.
Yellow lines are trend lines, trend channels and any other technical patterns.
Indicator 1 on the COT charts is the size of the net position of each category of traders.
Indicator 2 on the COT charts is the size of the net position for the non-commercial group.