empty
 
 
28.11.2022 12:09 PM
ETHUSD Potential For Bearish Continuation | 28th November 2022

This image is no longer relevant

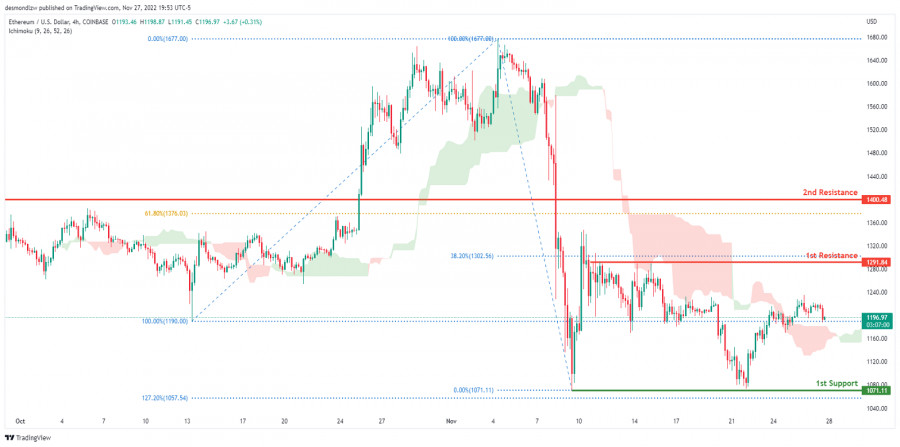
Looking at the H4 chart, my overall bias for ETHUSD is bearish due to the current price being below the Ichimoku cloud, indicating a bearish market .If this bearish momentum continues, expect price to possibly head towards the 1st support at 1071.11, where the -previous swing low is located. In an alternate scenario, price could possibly head back up towards the 1st resistance level at 1291.84, where the 38.2% Fibonacci line is located.

Trading Recommendation

Entry: 1302.56

Reason for Entry: 1st resistance line

Take Profit:1071.11

Reason for Take Profit: 1st support line

Stop Loss: 1677.00

Reason for Stop Loss:

Slightly above where the 2nd resistance line is located.

Dean Leo,
Analytical expert of InstaForex
© 2007-2023
EURUSD
Euro vs US Dollar
Select timeframe
5
min
15
min
30
min
1
hour
4
hours
1
day
1
week
Start trade
Start trade
USDCHF, H4 | Potential Reversal ?
the USD/CHF chart, it can be seen that the overall momentum is currently bearish. However, in the short term, price could potentially drop further to the 1st support level at 0.9136 before rebounding from there and rising towards the 1st resistance level at 0.9238. The 1st support level is.
Author: Dean Leo
01:57 2023-03-23 UTC--4
1780
EURUSD, H4 | Potential Bearish Reversal?
It appears that the overall momentum is bearish, indicating a potential drop in price in the longer term. However, in the short term, price could potentially rise towards the 1st resistance level at 1.093 before reversing and heading towards the 1st support level at 1.077. At 1.077, we have a.
Author: Dean Leo
01:56 2023-03-23 UTC--4
2050
USDCAD, H4 | Respected descending trendline ?
The charts indicate that the USD/CAD currency pair is currently experiencing a bearish momentum, with price situated below a significant descending trend line. As such, it is likely that the bearish trend will continue. In the event of a drop in price, there are two potential support levels that.
Author: Dean Leo
01:55 2023-03-23 UTC--4
1720
Show more
  • Grand Choice
    Contest by
    InstaForex
    InstaForex always strives to help you
    fulfill your biggest dreams.
    JOIN CONTEST
  • Chancy Deposit
    Deposit your account with $3,000 and get $8000 more!
    In March we raffle $8000 within the Chancy Deposit campaign!
    Get a chance to win by depositing $3,000 to a trading account. Having fulfilled this condition, you become a campaign participant.
    JOIN CONTEST
  • Trade Wise, Win Device
    Top up your account with at least $500, sign up for the contest, and get a chance to win mobile devices.
    JOIN CONTEST
  • 100% Bonus
    Your unique opportunity to get a 100% bonus on your deposit
    GET BONUS
  • 55% Bonus
    Apply for a 55% bonus on your every deposit
    GET BONUS
  • 30% Bonus
    Receive a 30% bonus every time you top up your account
    GET BONUS

Recommended Stories

EUR/USD reaches upper median line as expected

EUR/USD climbed as much as 1.0929 today where it has found resistance again. Now, it is trading lower at 1.0895 at the time of writing. The bias remains bullish despite

Ralph Shedler 18:40 2023-03-23 UTC+2

GBP/USD: rising wedge in progress

The GBP/USD pair registered a strong leg higher in the short term and now is trading at 1.2314 at the time of writing. Now, it stands right below important upside

Ralph Shedler 18:39 2023-03-23 UTC+2

Technical analysis of EUR/USD for March 23, 2023

The bullish bias will be suggested for today, supported by the EMA100 that carries the price from above, taking into consideration that breaking 1.0819 will stop the expected rise

Mourad El Keddani 17:28 2023-03-23 UTC+2

Forecast for EUR/USD on March 23, 2023

On Wednesday, the EUR/USD pair kept on rising and managed to remain above the corrective level of 200.0% (1.0861), moving above the trend channel. The growth can now be carried

Samir Klishi 16:50 2023-03-23 UTC+2

March 23, 2023 : EUR/USD daily technical review and trading opportunities.

The price level of 1.0800 remained a significant resistance level to offer SELL opportunities until the current upside movement was expressed. The next target is located around 1.1000 where

Mohamed Samy 16:45 2023-03-23 UTC+2

March 23, 2023 : EUR/USD Intraday technical analysis and trading plan.

Price action around the key-level of (1.0550-1.0600) was quite bullish. That's why, further bullish continuation towards 1.0800 was demonstrated. Moreover, more bullish advancement towards the nearest supply zone around 1.1150-1.1200

Mohamed Samy 16:42 2023-03-23 UTC+2

March 23, 2023 : GBP/USD Intraday technical analysis and significant key-levels.

The GBPUSD bulls failed to record a new high above 1.2200. Instead, a descending high was established around the same price level. Bearish pullback pursued towards the price levels

Mohamed Samy 16:41 2023-03-23 UTC+2

On Wednesday and Thursday, the GBP/USD pair continued to increase, and today it was trading near the level of 1.2342, according to the hourly chart. The US dollar's rebound from

Samir Klishi 16:16 2023-03-23 UTC+2

Trading Signal for GBP/USD for March 23 - 24, 2023: sell below 1.2329 (5/8 Murray - correction)

The pivot point is located at 1.2268. In case the British pound approaches this level in the next few hours, it could offer a technical rebound. With this price action

Dimitrios Zappas 15:02 2023-03-23 UTC+2

Trading Signal for GOLD (XAU/USD) for March 23 - 24, 2023: sell below $1,978 or in case of pullback at $1,987 (7/8 Murray - strong resistance)

Since March 17, the Eagle indicator has been giving oversold signals. In case there is a technical rebound and if gold trades below 1,987, it will be considered an opportunity

Dimitrios Zappas 14:43 2023-03-23 UTC+2
Can't speak right now?
Ask your question in the chat.