EUR/USD 5M
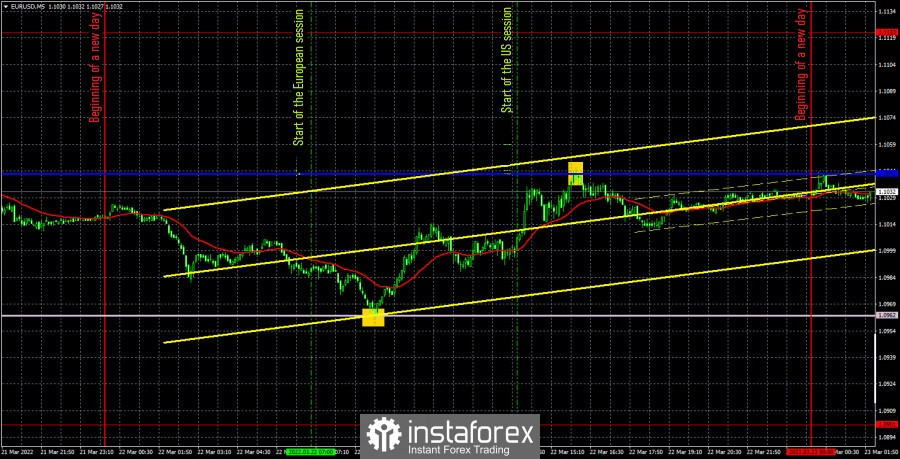
The EUR/USD pair showed almost perfect movement on Tuesday. Moreover, exclusively thanks to the Ichimoku indicator and its Kijun-sen and Senkou Span B lines. However, we will analyze the trading signals below. So far, it should be noted that the European currency tried to continue to adjust during the day, but could not go very far up. Volatility has slightly increased compared to Monday, but this does not play a special role now. At this time, the price is located below the critical line, which means that the downward trend can resume at any time. Recall that two days earlier, European Central Bank President Christine Lagarde once again made it clear that the European economy is too weak to tighten monetary policy. At the same time, Federal Reserve Chairman Jerome Powell has intensified his hawkish rhetoric. Therefore, we still believe that the dollar is more likely to rise in the current circumstances.
Now as for trading signals. The first one was formed near the Senkou Span B line, for long positions. The price just perfectly worked out this line and bounced off it. Subsequently, it went up 70 points and bounced off the critical line perfectly in accuracy. Therefore, it was possible and necessary to take 60 points profit on this transaction. The sell signal from the Kijun-sen line also had to be worked out. However, it has not brought the same profit as the first transaction. It was possible to earn a maximum of 15 points on it if you manually close the deal in time. But in any case, it turned out to earn an impressive amount.
COT report:
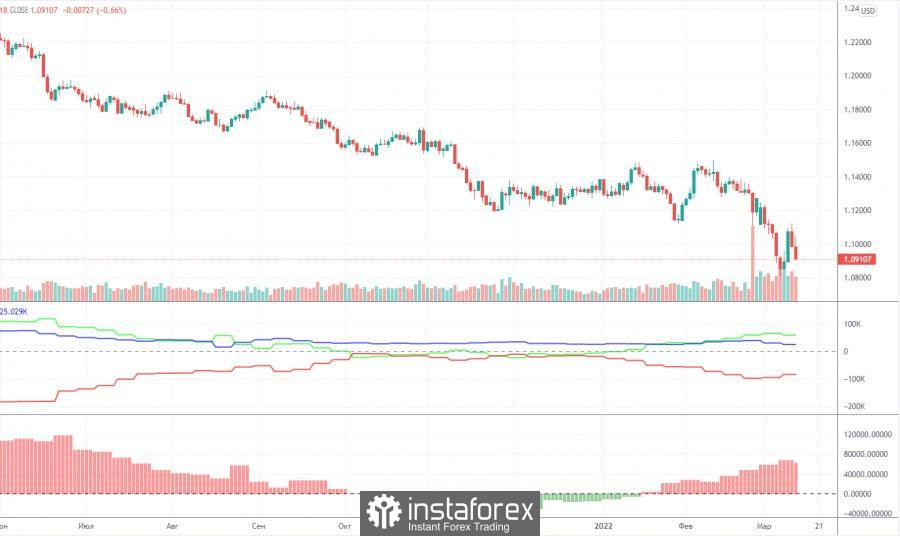
In the last two months, Commitment of Traders (COT) reports have signaled such changes in the mood of traders that absolutely did not correspond to what was actually happening in the foreign exchange market. Simply put, the euro continued to fall, while big commercial traders raised long positions. We said that such a divergence could arise due to the fact that the demand for the US currency increased sharply, which was simply higher than for the euro. However, the latest COT report showed that big players are also starting to change their preferences. During the last reporting week, the non-commercial group reduced the number of long positions by 40,000. That's a lot. The general mood of non-commercial traders still remains bullish, as the number of long positions exceeds the number of short positions by 19,000. However, trends are important to us. And now the trend is such that even major players can start selling the euro again. This is on top of the fact that the demand for the US dollar also remains high. Thus, the net position of the non-commercial group decreased significantly last week and now almost all factors speak in favor of a further fall in the euro currency. Therefore, the euro can now show growth from time to time only on the basis of technical necessity to adjust.
We recommend to familiarize yourself with:
Overview of the EUR/USD pair. March 23. The gap between the ECB and the Fed is widening.
Overview of the GBP/USD pair. March 23. Joe Biden goes to Brussels to negotiate the rejection of Russian oil and gas.
Forecast and trading signals for GBP/USD on March 23. Detailed analysis of the movement of the pair and trading transactions.
EUR/USD 1H
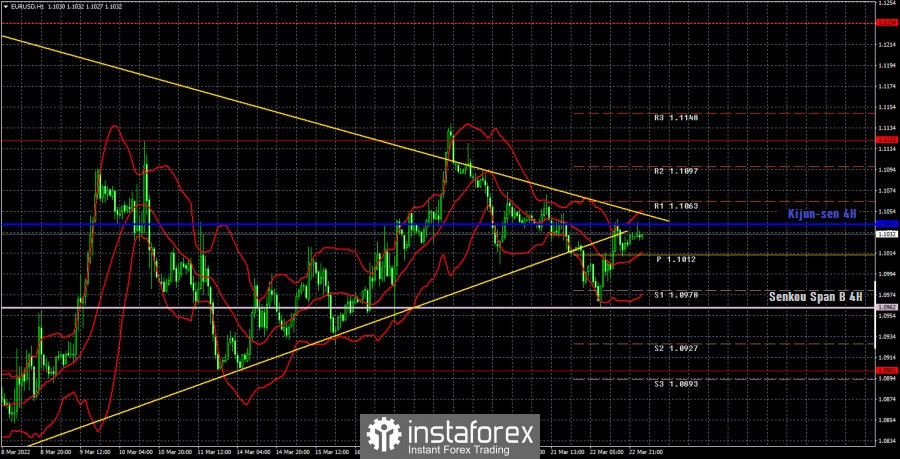
Only the descending trend line remains relevant on the hourly timeframe. But even it was previously breached. More significant now is the fact that the price is located below the critical line. If it is overcome, then the pair may try to return to the level of 1.1122, which it has already failed to overcome at least twice. If the price goes below the Senkou Span B line, then it will rush to its annual lows. On Wednesday, we allocate the following levels for trading - 1.0901, 1.1122, 1.1234, as well as the Senkou Span B(1.0962) and Kijun-sen(1.1042) lines. There are also support and resistance levels, but no signals will be formed near them. The lines of the Ichimoku indicator may change their position during the day, which should be taken into account when searching for trading signals. Signals can be "bounces" and "breakthrough" levels - extremes and lines. Do not forget about placing a Stop Loss order at breakeven if the price went in the right direction of 15 points. This will protect you against possible losses if the signal turns out to be false. The only important event of the day on March 23 will be Powell's speech. However, recall that Powell, who is currently conducting the market, has rhetoric that can provoke a new strengthening of the US currency, as the Fed is increasingly taking a course to tighten monetary policy every month. Thus, we believe that this event may provoke a market reaction. But there will be nothing to pay attention to in the European Union today.
Explanation for the chart:
Support and Resistance Levels are the levels that serve as targets when buying or selling the pair. You can place Take Profit near these levels.
Kijun-sen and Senkou Span B lines are lines of the Ichimoku indicator transferred to the hourly timeframe from the 4-hour one.
Support and resistance areas are areas from which the price has repeatedly rebounded off.
Yellow lines are trend lines, trend channels and any other technical patterns.
Indicator 1 on the COT charts is the size of the net position of each category of traders.
Indicator 2 on the COT charts is the size of the net position for the non-commercial group.