Analysis of previous deals:
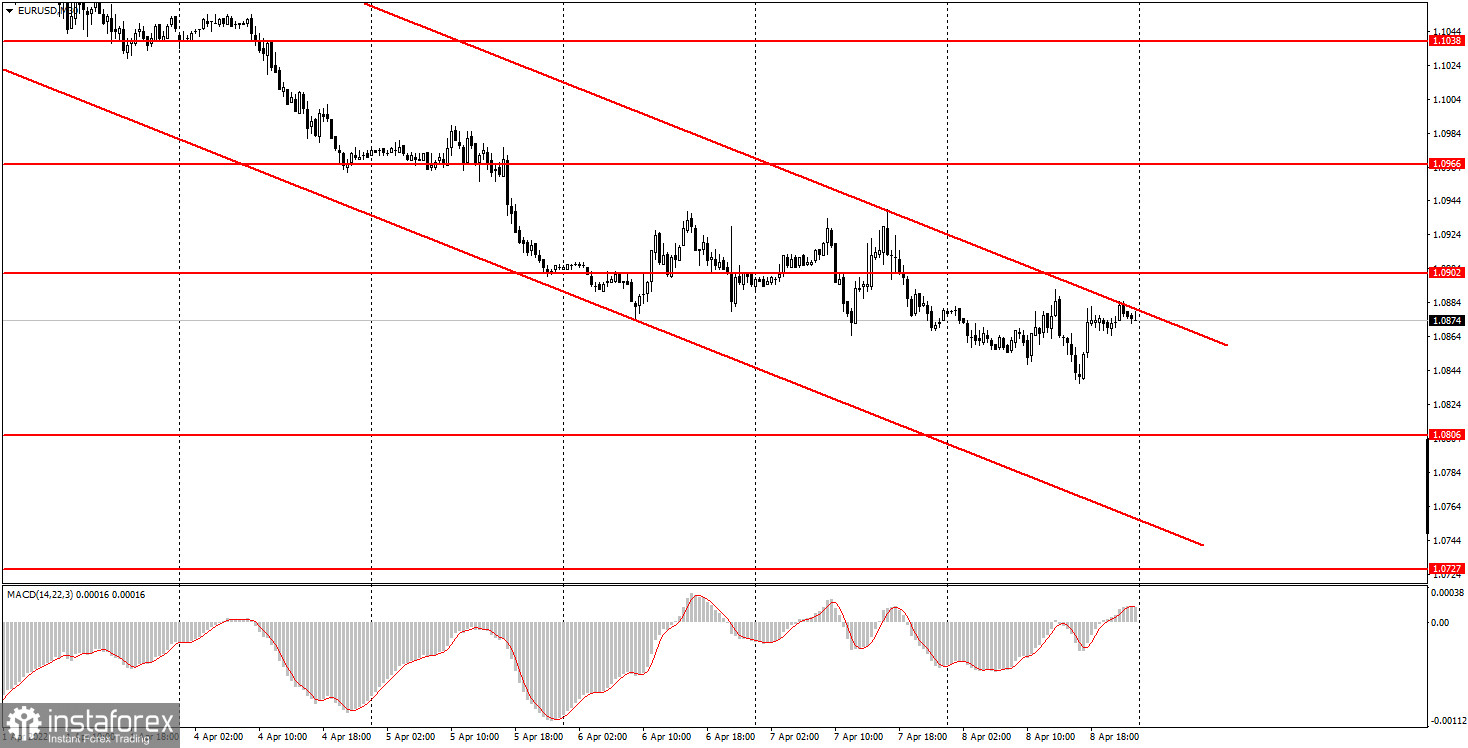
30M chart of the EUR/USD pair
The EUR/USD currency pair on Friday did not show the movement that traders expected. As you can see in the chart above, the downward trend has been maintained over the past few days, but at the same time the downward movement was extremely weak, and the pair regularly rolled back up. These pullbacks cannot be called corrections, but they were almost the same in size as the main downward movement. As a result, we got a movement as similar as possible to the "flat". And it is always very difficult to trade in the flat. Apart from that, there were no important macroeconomic statistics on Friday. Neither in the US, nor in the European Union. By and large, this week all the news was about geopolitics and the Federal Reserve. Recall that new sanctions were imposed against the Russian Federation, which further aggravates the conflict between Russia and the West. Recall that several representatives of the Fed Monetary committee and the Fed minutes made it clear that in May the rate will be increased by 0.5%, and the balance of the central bank will begin to decrease. These are hawkish steps that are already supporting the US currency. Therefore, the fact that the dollar continues to grow in tandem with the euro does not surprise us at all. However, the very nature of the movement now leaves much to be desired. We have finally formed a descending channel, but it is quite formal, since the second pivot point raises a lot of questions. The price is already near the upper limit of the channel, so it can settle above it on Monday. But this does not mean that growth will begin.
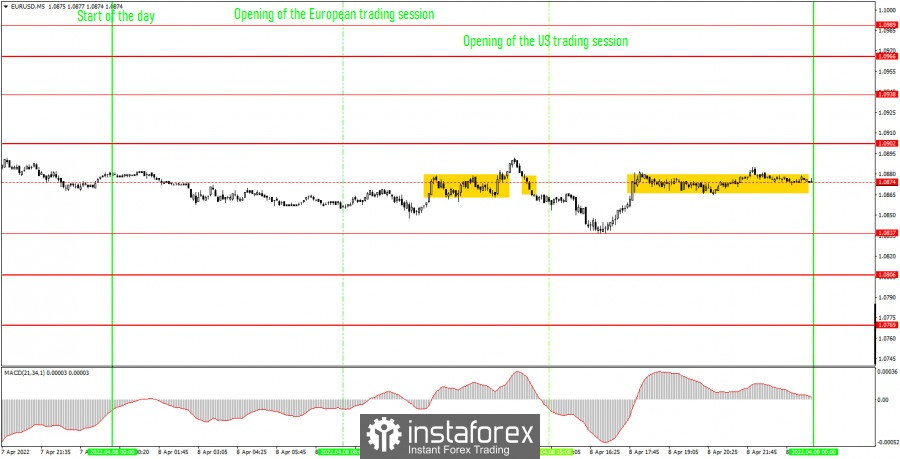
5M chart of the EUR/USD pair

The movement on Friday looks absolutely flat on the 5-minute timeframe. This is clearly visible. We should immediately note that a new level (1.0837) has been added – Friday's low, and the level of 1.0874 has been removed from the chart. Since the pair was in a sideways movement, all trading signals formed around the same level. The first buy signal was formed when the price settled above the 1.0874 level, after which it managed to go up "as much as" 10 points. The signal turned out to be false. This was followed by a sell signal forming near the same level of 1.0874, after which the pair went down about 23 points, which was enough at least to place a Stop Loss order at breakeven. Therefore, it was impossible to make a loss on a short position. There could have been a profit, but for this the transaction had to be closed manually, since the pair could not fall to the target level of 1.0806. The third signal was not even a signal, as the pair rose to 1.0874 and began to move just along this level.
How to trade on Monday:
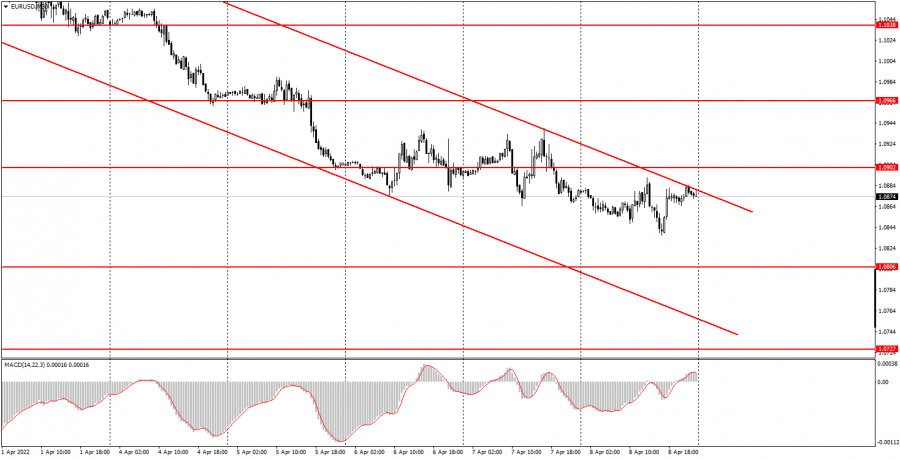
The downward trend persists on the 30-minute timeframe, but the downward channel is now present in the chart solely for visualization. If a rebound occurs from its upper limit, it can be regarded as a sell signal. But overcoming this line does not ensure that the euro would sharply rise. The geopolitical and fundamental background continues to be on the dollar's side. On the 5-minute TF tomorrow, it is recommended to trade by levels 1.0769, 1.0806, 1.0837, 1.0902, 1.0938, 1.0966, 1.0989, 1.1038. When passing 15 points in the right direction, you should set the Stop Loss to breakeven. No important events in either the European Union or America on Monday. Thus, traders will have nothing to pay attention to, and the flat may persist.
Basic rules of the trading system:
1) The signal strength is calculated by the time it took to form the signal (bounce or overcome the level). The less time it took, the stronger the signal.
2) If two or more deals were opened near a certain level based on false signals (which did not trigger Take Profit or the nearest target level), then all subsequent signals from this level should be ignored.
3) In a flat, any pair can form a lot of false signals or not form them at all. But in any case, at the first signs of a flat, it is better to stop trading.
4) Trade deals are opened in the time period between the beginning of the European session and until the middle of the American one, when all deals must be closed manually.
5) On the 30-minute TF, using signals from the MACD indicator, you can trade only if there is good volatility and a trend, which is confirmed by a trend line or a trend channel.
6) If two levels are located too close to each other (from 5 to 15 points), then they should be considered as an area of support or resistance.
On the chart:
Support and Resistance Levels are the Levels that serve as targets when buying or selling the pair. You can place Take Profit near these levels.
Red lines are the channels or trend lines that display the current trend and show in which direction it is better to trade now.
The MACD indicator (14,22,3) consists of a histogram and a signal line. When they cross, this is a signal to enter the market. It is recommended to use this indicator in combination with trend lines (channels and trend lines).
Important speeches and reports (always contained in the news calendar) can greatly influence the movement of a currency pair. Therefore, during their exit, it is recommended to trade as carefully as possible or exit the market in order to avoid a sharp price reversal against the previous movement.
Beginners on Forex should remember that not every single trade has to be profitable. The development of a clear strategy and money management are the key to success in trading over a long period of time.