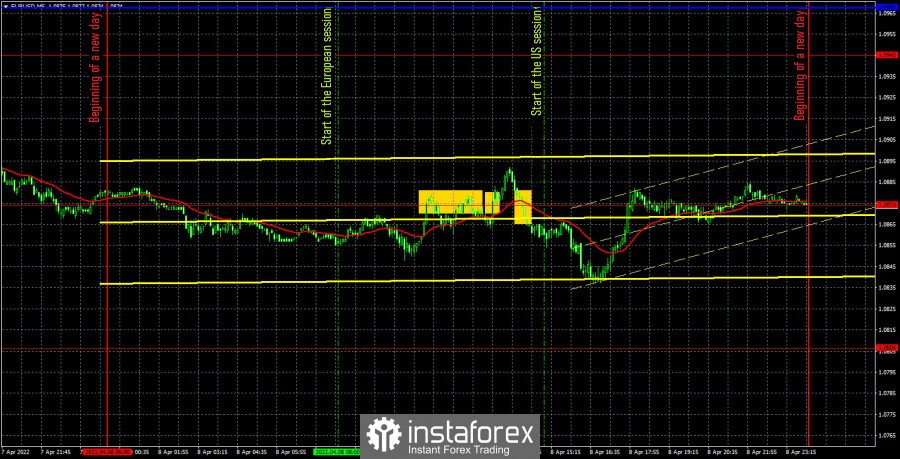
EUR/USD 5M
The EUR/USD pair showed nothing special on Friday. Despite the fact that according to the results of the last three days of the week, the pair declined even more, nevertheless, the movement was as similar as possible to a flat. Therefore, it was difficult to work it out. Another feature of the flat is that the price very often crosses the same price areas, and at the same time the levels within them. And these levels, it turns out, do not have any resistance to the price and are subject to removal. As a result, there are fewer levels, and the movement is as flat as possible. The euro tried to continue falling on Friday, but the market remembered that there would be more bad news, so you can not rush to sell the euro. There were no important macroeconomic events on this day, and there was no important geopolitical news. Therefore, the volatility equal to 55 points is quite understandable.
As for trading signals, there were several of them on Friday. All of them were formed near the extreme level of 1.0874, which was removed from the chart by the end of Friday. First, the price bounced off it, forming a sell signal, which turned out to be false, therefore it overcame it by forming a buy signal, which also turned out to be false. As a result, two false signals and the third, which also turned out to be false, clearly should not have been worked out. For the first two transactions, it was possible to get a minimal loss. Unfortunately, despite the fact that there seems to be an unambiguous downward trend, intraday movement quite often leaves much to be desired.
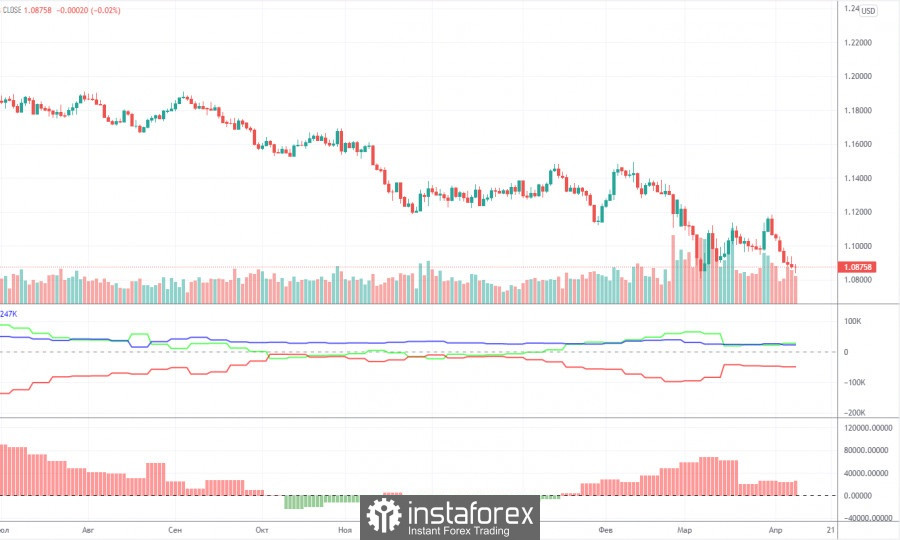
COT report:

The latest Commitment of Traders (COT) report turned out to be more interesting than the previous ones. Even paradoxical, because the big players were building long positions. During the reporting week, the number of longs increased by 10,800, and the number of shorts in the "non-commercial" group - by 4,800. Thus, the net position increased by 6,000 contracts. This means that the bullish mood has intensified. It is bullish, since the total number of long positions now exceeds the total number of short positions with non-commercial traders by almost 30,000. Accordingly, the paradox lies in the fact that the mood of traders is bullish, but the euro is falling almost non-stop. We have already explained in previous articles that this effect is achieved by an even higher demand for the US dollar. It turns out that the demand for the dollar is higher than the demand for the euro, which is why the dollar is rising against the euro currency. Based on this conclusion, these COT reports on the euro currency now do not make it possible to predict the pair's further movement. They are, one might say, meaningless. However, if the demand for the euro starts to fall among professional players, this may lead to an even greater fall in the euro, since the demand for the dollar is likely to remain high due to geopolitics and macroeconomics.
We recommend to familiarize yourself with:
Overview of the EUR/USD pair. April 11. The presidential election in France may change the mood within the European Union.
Overview of the GBP/USD pair. April 11. Key events of the week: US and British inflation.
Forecast and trading signals for GBP/USD on April 11. Detailed analysis of the movement of the pair and trading transactions.
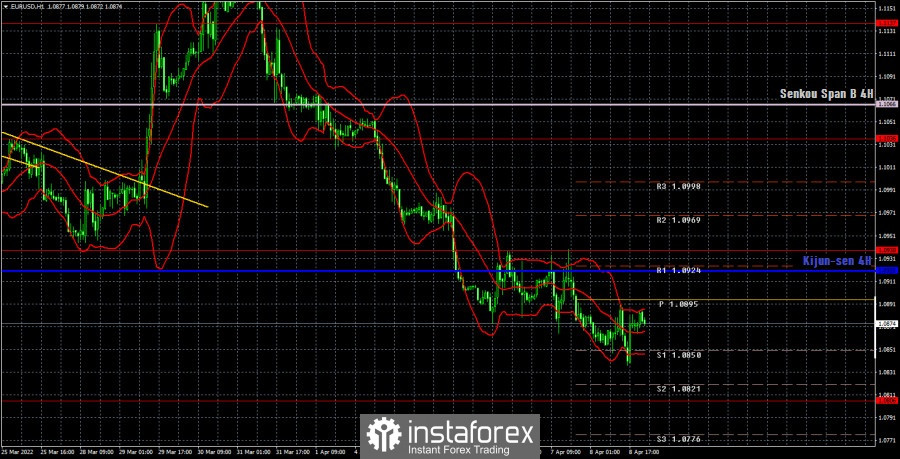
EUR/USD 1H

It is clearly visible on the hourly timeframe that the pair continues its decline, but it is still impossible to form either a trend line or a descending channel. Thus, it is possible to focus at this time only on the lines of the Ichimoku indicator and on the extreme levels. In general, the geopolitical, fundamental and macroeconomic backgrounds remain negative for the euro, so we expect the pair to continue falling. However, it should be recognized that the recoilless fall of the euro is already 350 points. Technical correction may also begin. On Monday, we allocate the following levels for trading – 1.0729, 1.0806, 1.0938, 1.1036, as well as the Senkou Span B (1.1066) and Kijun-sen (1.0920) lines. The lines of the Ichimoku indicator can move during the day, which should be taken into account when determining trading signals. There are also support and resistance levels, but no signals will be formed near them. Signals can be "bounces" and "breakthrough" levels - extremes and lines. Do not forget about placing a Stop Loss order at breakeven if the price went in the right direction of 15 points. This will protect you against possible losses if the signal turns out to be false. There are no important or even interesting events planned for April 11 in the European Union and the United States. Therefore, today, after "boring Thursday" and "boring Friday", we can expect no less a "boring Monday".
Explanations for the chart:
Support and Resistance Levels are the levels that serve as targets when buying or selling the pair. You can place Take Profit near these levels.
Kijun-sen and Senkou Span B lines are lines of the Ichimoku indicator transferred to the hourly timeframe from the 4-hour one.
Support and resistance areas are areas from which the price has repeatedly rebounded off.
Yellow lines are trend lines, trend channels and any other technical patterns.
Indicator 1 on the COT charts is the size of the net position of each category of traders.
Indicator 2 on the COT charts is the size of the net position for the non-commercial group.