empty
 
 
30.01.2023 09:16 PM
Technical analysis of EUR/USD for January 30, 2023

This image is no longer relevant

Overview :

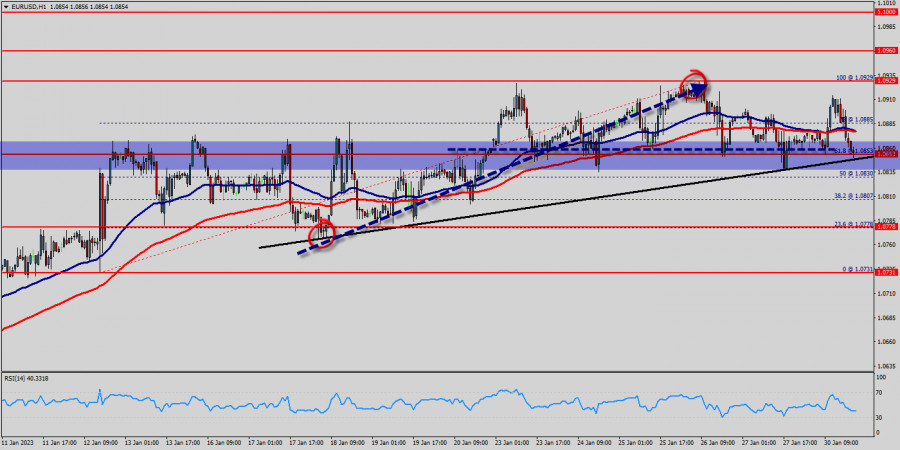
The EUR/USD pair is at highest against the dollar around the spot of 1.0800 - 1.0846 for four weeks. The EUR/USD pair is inside in upward channel. This week, the EUR/USD pair decreased within an up channel, for that Euro its new highest 1.0929. But the trend rebounded from the resistance 1.0929 to close at 1.0846 on the hourly chart.

Closing above the daily pivot point (1.0830) could assure that the EUR/USD pair will move higher towards cooling new highs.

The bulls must break through 1.0850 in order to resume the uptrend. Consequently, the first support is set at the level of 1.0800. Hence, the market is likely to show signs of a bullish trend around the area of 1.0800 and 1.0846.

The EUR/USD pair reverses from 1.0929 and drops to multi-day lows near 1.0846 - this price formed a bottom this morning in the hourly chart. Right now, the EUR/USD pair dropped further and bottomed at 1.0800. It then trimmed losses, rising to from 1.0830.

The move lower took place amid a stronger US dollar across the board. Probably, the main scenario is continued decline towards 1.0200 (sentiment level).

The level of 1.0830 coincides with the golden ratio (50% of Fibonacci retracement) which is acting as major support today.

Another thought:

The Relative Strength Index (RSI) is considered overbought because it is above 40. The EUR/USD pair price could be awaiting a major upswing if the digital savings manages to slice above a fatal line of the first resistance that sets at the price of 1.0853 (Horizontal red line).

The prevailing chart pattern suggests that if the leading the trend could be expecting to rebound from the levels of 1.0800 and 1.0846 so as to continue uptrend.

Moreover, if the EUR/USD pair fails to break through the support prices of 1.0830 today, the market will rise further to 1.0929 so as to try to break it.

The EUR/USD pair is one the best overall investment for in coming weeks. However, if you want to try to improve the growth of Euro, thus it seems great to buy above the last bearish waves of 1.0853.

EURUSD
Euro vs US Dollar
Select timeframe
5
min
15
min
30
min
1
hour
4
hours
1
day
1
week
Start trade
Start trade
  • Grand Choice
    Contest by
    InstaForex
    InstaForex always strives to help you
    fulfill your biggest dreams.
    JOIN CONTEST
  • Chancy Deposit
    Deposit your account with $3,000 and get $8000 more!
    In March we raffle $8000 within the Chancy Deposit campaign!
    Get a chance to win by depositing $3,000 to a trading account. Having fulfilled this condition, you become a campaign participant.
    JOIN CONTEST
  • Trade Wise, Win Device
    Top up your account with at least $500, sign up for the contest, and get a chance to win mobile devices.
    JOIN CONTEST
  • 100% Bonus
    Your unique opportunity to get a 100% bonus on your deposit
    GET BONUS
  • 55% Bonus
    Apply for a 55% bonus on your every deposit
    GET BONUS
  • 30% Bonus
    Receive a 30% bonus every time you top up your account
    GET BONUS

Recommended Stories

March 24, 2023 : EUR/USD daily technical review and trading opportunities.

The price level of 1.0800 remained a significant resistance level to offer SELL opportunities until the current upside movement was expressed. The next target is located around 1.1000 where

Mohamed Samy 16:55 2023-03-24 UTC+2

March 24, 2023 : EUR/USD Intraday technical analysis and trading plan.

Price action around the key-level of (1.0550-1.0600) was quite bullish. That's why, further bullish continuation towards 1.0800 was demonstrated. Moreover, more bullish advancement towards the nearest supply zone around 1.1150-1.1200

Mohamed Samy 16:54 2023-03-24 UTC+2

March 24, 2023 : GBP/USD Intraday technical analysis and significant key-levels.

The GBPUSD bulls failed to record a new high above 1.2200. Instead, a descending high was established around the same price level. Bearish pullback pursued towards the price levels

Mohamed Samy 16:53 2023-03-24 UTC+2

GBP/USD: reversal pattern activated

The GBP/USD pair crashed in the short term as the Dollar Index rebounded. Yesterday, I talked about exhausted buyers and about a Rising Wedge pattern. The pair's trading at 1.2225

Ralph Shedler 16:48 2023-03-24 UTC+2

Trading Signal for USD/JPY for March 24 - 27, 2023: buy above 130.10 (3/8 Murray - rebound)

Early in the US session, the Japanese Yen is trading around 130.10 bouncing after reaching a low around 129.62, the level which coincides with 3/8 Murray (129.68). Japanese yen like

Dimitrios Zappas 15:14 2023-03-24 UTC+2

EUR/USD: technical analysis on March 24, 2023

Hello, dear traders! On Thursday, EUR/USD reversed to the downside and almost approached the lower line of the ascending trend corridor, which indicates a bullish bias. Consolidation below the corridor

Samir Klishi 11:25 2023-03-24 UTC+2

GBP/USD: technical analysis on March 24, 2023. BoE raises rates for 11th time

Hello, dear traders! On the 1-hour chart, GBP/USD bounced off 1.2342, reversed to the downside, and headed toward 1.2238 and the lower limit of the ascending corridor. This line illustrates

Samir Klishi 11:25 2023-03-24 UTC+2

Forex forecast 03/24/2023 GBP/USD, USD/CHF, USD/CAD and Bitcoin from Sebastian Seliga

Let's take a look at the technical picture of GBP/USD, USD/CHF, USD/CAD and Bitcoin

Sebastian Seliga 09:59 2023-03-24 UTC+2

Video market update for March 24, 2023

Potential for the rally on USD/JPY

Petar Jacimovic 09:35 2023-03-24 UTC+2

USD/JPY analysis for March 24, 2023 - Potential for the rally

Technical analysis: USD/JPY has been trading downside in the background but I found falling wedge pattern in creation and potential upside movement. Due to potential downside exhaustion and bull crosses

Petar Jacimovic 09:35 2023-03-24 UTC+2
Can't speak right now?
Ask your question in the chat.