EUR/USD 5M
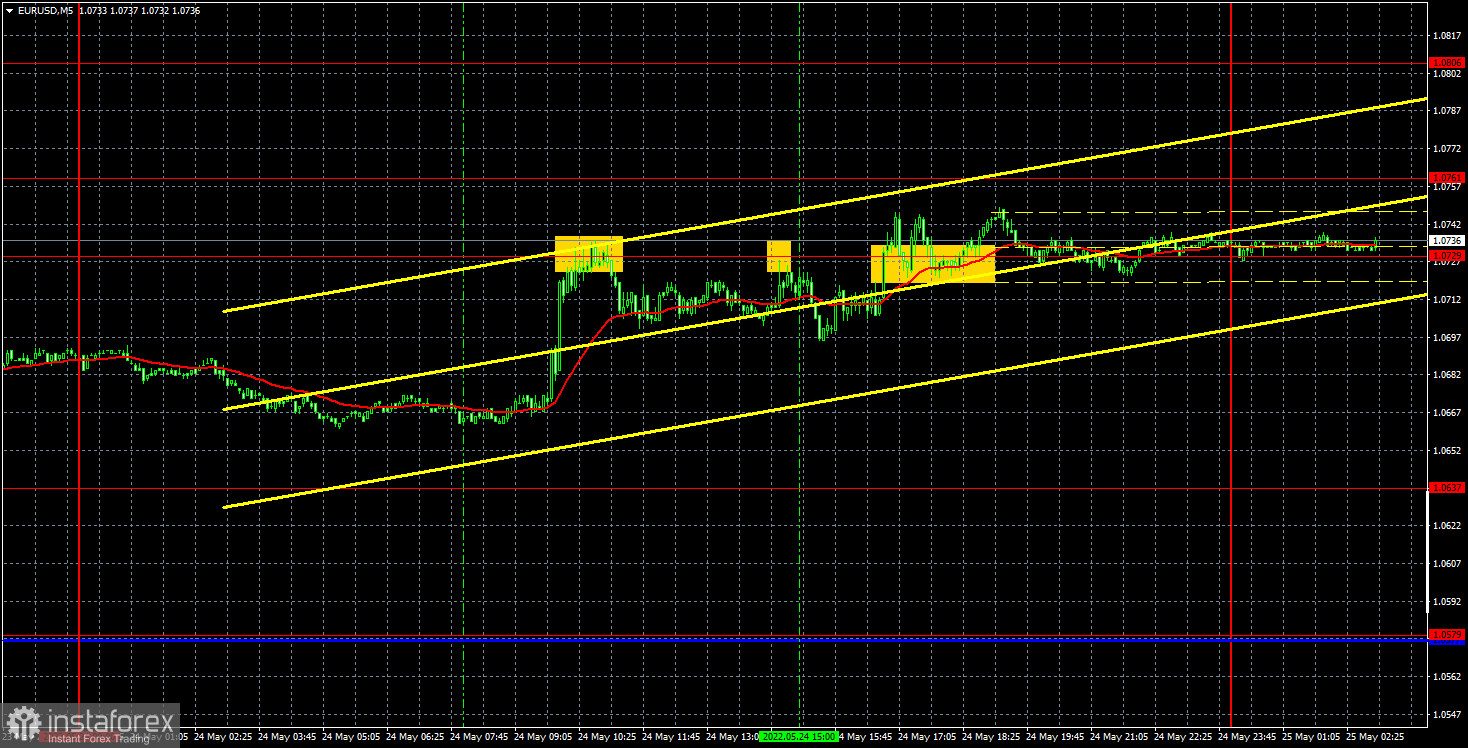
The EUR/USD pair made a rather strong upward spurt in the morning, but during the day the upward momentum subsided, and the pair traded more calmly. However, by the end of the day, the European currency still showed steady growth and good volatility. Take note that there were a lot of macroeconomic statistics on Tuesday. Four reports on business activity in the US and the EU had little chance of influencing the course of trading, as they are not important themselves. Thus, we can say that macroeconomics did not have any influence on the pair's movement on Tuesday either. Just like Monday. Accordingly, the first two days of the week passed without the influence of external factors, but the euro still continued to rise. From our point of view, this indicates that the market is set to buy the pair. It does not need good reasons now to buy euros. Thus, the upward trend continues, although it bears exclusively technical support factors.
There were few trading signals yesterday. The pair bounced twice from the extreme level of 1.0729, forming sell signals. Both times it went down 20-25 points, which was enough to set Stop Loss to breakeven. Thus, traders did not receive a loss on both of these transactions. The upward move in the morning was missed as it was not preceded by a signal for long positions. The pair settled above the level of 1.0729 during the US trading session, but was no longer able to continue moving up and went up only 5-10 points. However, since the price did not go below the level of 1.0729 until the very evening, there was no loss on this transaction either. Not the best trading day, but without a loss.
COT report:
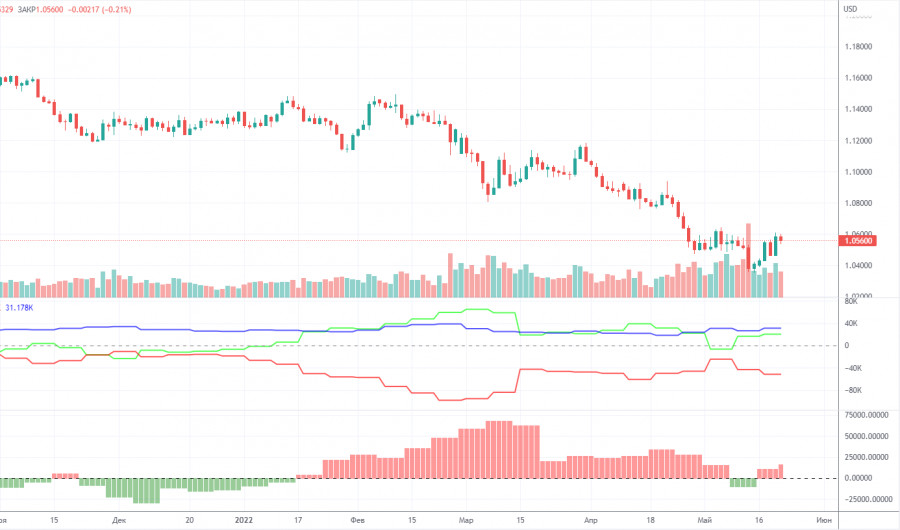
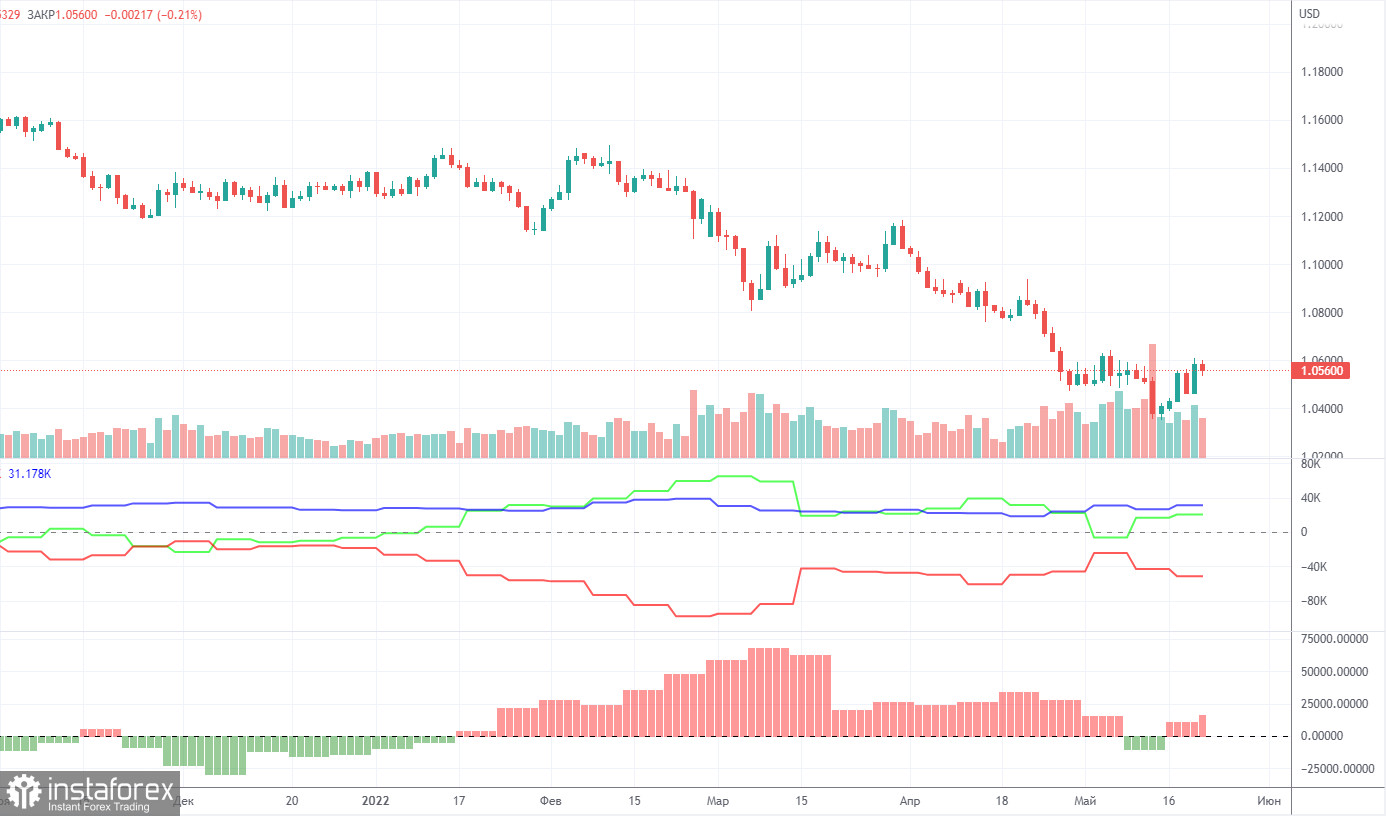
The latest Commitment of Traders (COT) reports on the euro caused and continue to raise more and more questions. The COT report showed the bearish mood of major players only once in the past few months, but in the last two weeks, the bullish mood is intensifying again. That is, a paradoxical situation remains, in which the euro currency has been falling for a long time, but professional players are buying up the euro, and not selling it. During the reporting week, the number of long positions increased by 2,500, while the number of shorts in the non-commercial group decreased by 1,200. Thus, the net position grew by 3,700 contracts per week. The number of longs exceeds the number of shorts for non-commercial traders by 20,000. From our point of view, this happens because the demand for the US dollar is much higher than the demand for the euro. Even if someone suggested that the whole point is the weakening of the bullish mood in recent months (the second indicator is the histogram), then this is hardly the case. The euro simply refuses to grow, despite any actions of major players. The chart above clearly shows that the euro fell both when the net position grew (increasing bullish sentiment) and when the net position decreased (weakened bullish sentiment). Thus, it is still impossible to draw a correlation between COT reports and what is happening in the market. It makes no sense to build forecasts on such data, all the more.
We recommend to familiarize yourself with:
Overview of the EUR/USD pair. May 25. Euro continues to tear and throw, and Lagarde is supporting the euro for the first time in a long time.
Overview of the GBP/USD pair. May 25. Betting, betting and more betting... Bailey's rhetoric could pull down the pound
Forecast and trading signals for GBP/USD on May 25. Detailed analysis of the movement of the pair and trading transactions.
EUR/USD 1H
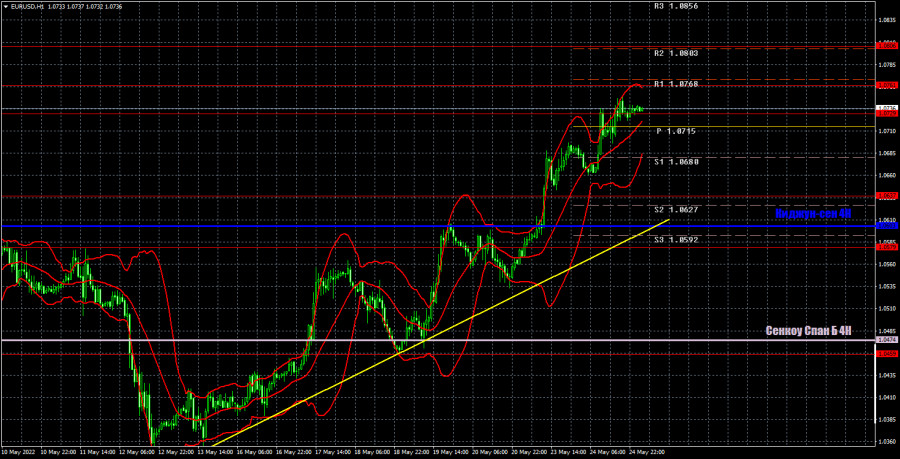
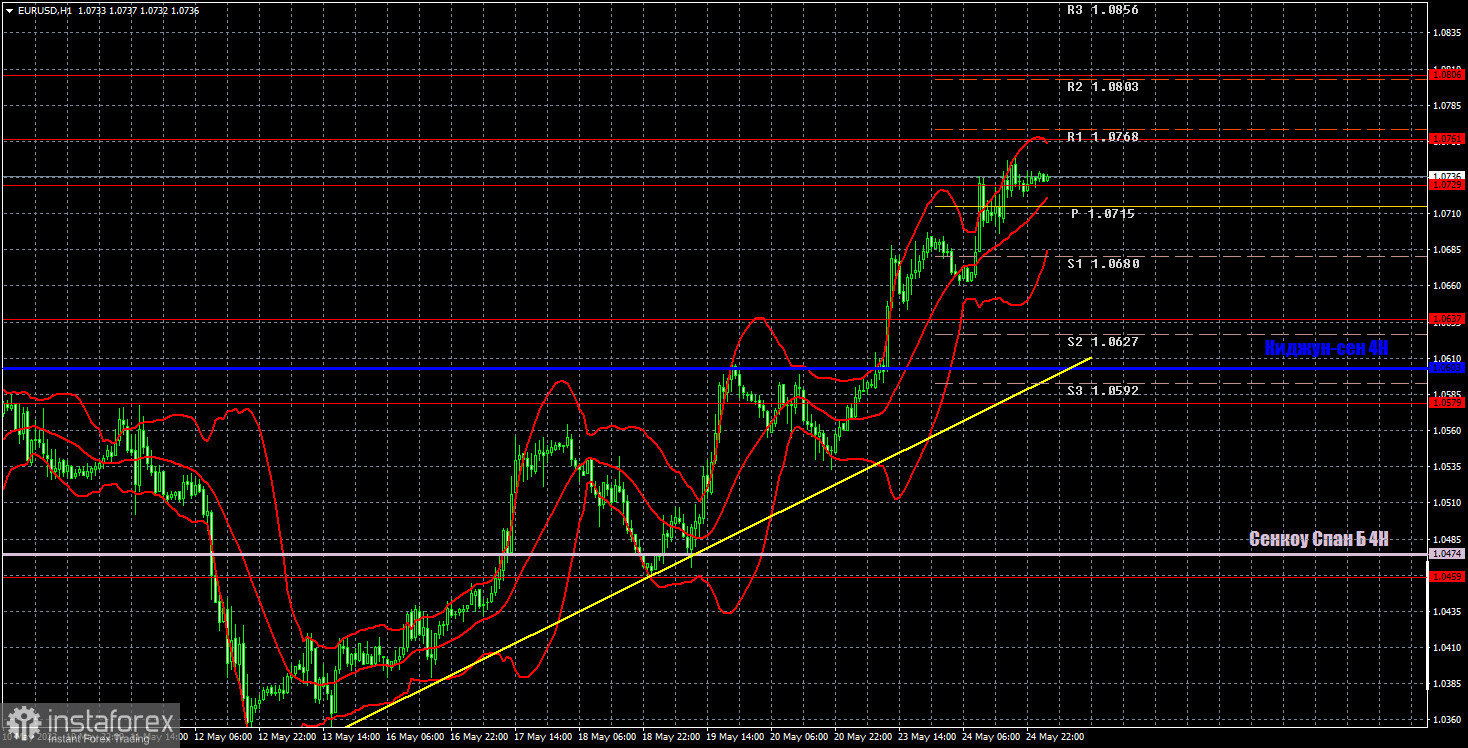
It is clearly seen on the hourly timeframe that the pair continues a fairly strong upward movement, and the ascending trend line remains relevant. Despite the fact that the euro's growth is now purely technical, how do we know why the euro is growing? There is a trend, there is a trend line - you need to trade! Today we highlight the following levels for trading - 1.0459, 1.0579, 1.0637, 1.0729, 1.0761, 1.0806, as well as Senkou Span B (1.0474) and Kijun-sen (1 .0603). Ichimoku indicator lines can move during the day, which should be taken into account when determining trading signals. There are also secondary support and resistance levels, but no signals are formed near them. Signals can be "rebounds" and "breakthrough" extreme levels and lines. Do not forget about placing a Stop Loss order at breakeven if the price has gone in the right direction for 15 points. This will protect you against possible losses if the signal turns out to be false. European Central Bank President Christine Lagarde is set to speak in the European Union, and we also have a report on orders for durable goods in the US. Lagarde's speech could be interesting as she starts talking about a possible rate hike in the coming months. The order report is far from the most important.
Explanations for the chart:
Support and Resistance Levels are the levels that serve as targets when buying or selling the pair. You can place Take Profit near these levels.
Kijun-sen and Senkou Span B lines are lines of the Ichimoku indicator transferred to the hourly timeframe from the 4-hour one.
Support and resistance areas are areas from which the price has repeatedly rebounded off.
Yellow lines are trend lines, trend channels and any other technical patterns.
Indicator 1 on the COT charts is the size of the net position of each category of traders.
Indicator 2 on the COT charts is the size of the net position for the non-commercial group.