empty
 
 
28.11.2022 02:52 PM
Technical analysis of USD/CHF

#USD/CHF:

This image is no longer relevant

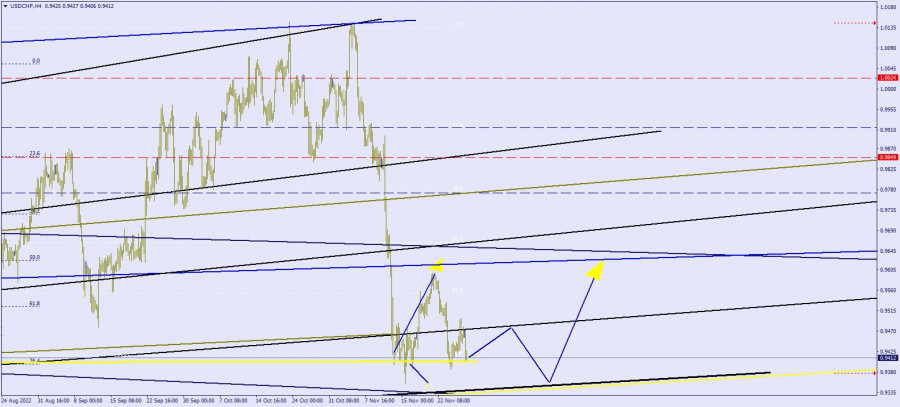
The chart shows the movement of USD/CHF on the 4-hour (H4) chart.

Quotes reached the key support level of 0.9397, which is very important for future dynamics. As long as the level remains strong, there could be an upward trend.

In fact, for so long, the pair tests 0.9600 then returns to the key support level. This allows further long positions in the market, usually located near the support level, with targets up to 0.9600.

But if the level is broken, the pair is likely to drop to the level of 0.9330.

Good luck!

Daniel Liderman,
Analytical expert of InstaForex
© 2007-2023
USDCHF
US Dollar vs Swiss Franc
Select timeframe
5
min
15
min
30
min
1
hour
4
hours
1
day
1
week
Start trade
Start trade
  • Grand Choice
    Contest by
    InstaForex
    InstaForex always strives to help you
    fulfill your biggest dreams.
    JOIN CONTEST
  • Chancy Deposit
    Deposit your account with $3,000 and get $8000 more!
    In March we raffle $8000 within the Chancy Deposit campaign!
    Get a chance to win by depositing $3,000 to a trading account. Having fulfilled this condition, you become a campaign participant.
    JOIN CONTEST
  • Trade Wise, Win Device
    Top up your account with at least $500, sign up for the contest, and get a chance to win mobile devices.
    JOIN CONTEST
  • 100% Bonus
    Your unique opportunity to get a 100% bonus on your deposit
    GET BONUS
  • 55% Bonus
    Apply for a 55% bonus on your every deposit
    GET BONUS
  • 30% Bonus
    Receive a 30% bonus every time you top up your account
    GET BONUS

Recommended Stories

March 27, 2023 : EUR/USD daily technical review and trading opportunities.

The price level of 1.0800 remained a significant resistance level to offer SELL opportunities until the current upside movement was expressed. The next target is located around 1.1000 where

Mohamed Samy 19:02 2023-03-27 UTC+2

March 27, 2023 : EUR/USD Intraday technical analysis and trading plan.

Price action around the key-level of (1.0550-1.0600) was quite bullish. That's why, further bullish continuation towards 1.0800 was demonstrated. Moreover, more bullish advancement towards the nearest supply zone around 1.1150-1.1200

Mohamed Samy 19:01 2023-03-27 UTC+2

March 27, 2023 : GBP/USD Intraday technical analysis and significant key-levels.

Recently, the GBPUSD bulls failed to record a new high above 1.2200. Instead, a descending high was established around the same price level. Bearish pullback pursued towards the price levels

Mohamed Samy 19:00 2023-03-27 UTC+2

Another attempt for USDJPY to reverse short-term trend.

USDJPY is trading around 131.53. Price is making another attempt to break out of the short-term bearish channel it is in since beginning of March. Price has so far retraced

Alexandros Yfantis 17:20 2023-03-27 UTC+2

Technical analysis on EURUSD for March 27th, 2023.

EURUSD is trading around 1.0780. Price has so far retraced 50% of the last upward move from 1.0517. Will EURUSD form a higher low? Support is at recent

Alexandros Yfantis 16:49 2023-03-27 UTC+2

Trading Signal for GOLD (XAU/USD) for March 27 - 28, 2023: buy above $1,944 (6/8 Murray - strong support)

Early in the American session, Gold (XAU/USD) is trading around 1,952.26, above the 200 EMA, and below the 21 SMA located at 1,973. Since the opening of this trading week

Dimitrios Zappas 16:43 2023-03-27 UTC+2

Technical analysis of EUR/USD and GBP/USD on March 27

Last week, the euro bulls cast a log shadow into the bullish zone relative to an intraday and one-week Ichimoku clouds, having tested 1.09101, the resistance of one-month medium-term trend

Evangelos Poulakis 13:02 2023-03-27 UTC+2

Forex forecast 03/27/2023 GBP/USD, EUR/USD, USD/JPY and Oil from Sebastian Seliga

Let's take a look at the technical picture of GBP/USD, EUR/USD, USD/JPY

Sebastian Seliga 11:24 2023-03-27 UTC+2

GBP/USD: technical analysis on March 27, 2023

Hello, dear traders! In the 1-hour time frame, GBP/USD settled below the ascending trend corridor and the 1.2238 mark on Friday. The price may drop to the 127.2% Fibonacci level

Samir Klishi 10:34 2023-03-27 UTC+2

EUR/USD: technical analysis on March 27, 2023

Hello, dear traders! On Friday, EUR/USD extended the downtrend toward 1.0750. On Monday, after consolidation below the level, the price may fall to the 161.8% Fibonacci level of 1.0609. Sentiment

Samir Klishi 10:34 2023-03-27 UTC+2
Can't speak right now?
Ask your question in the chat.