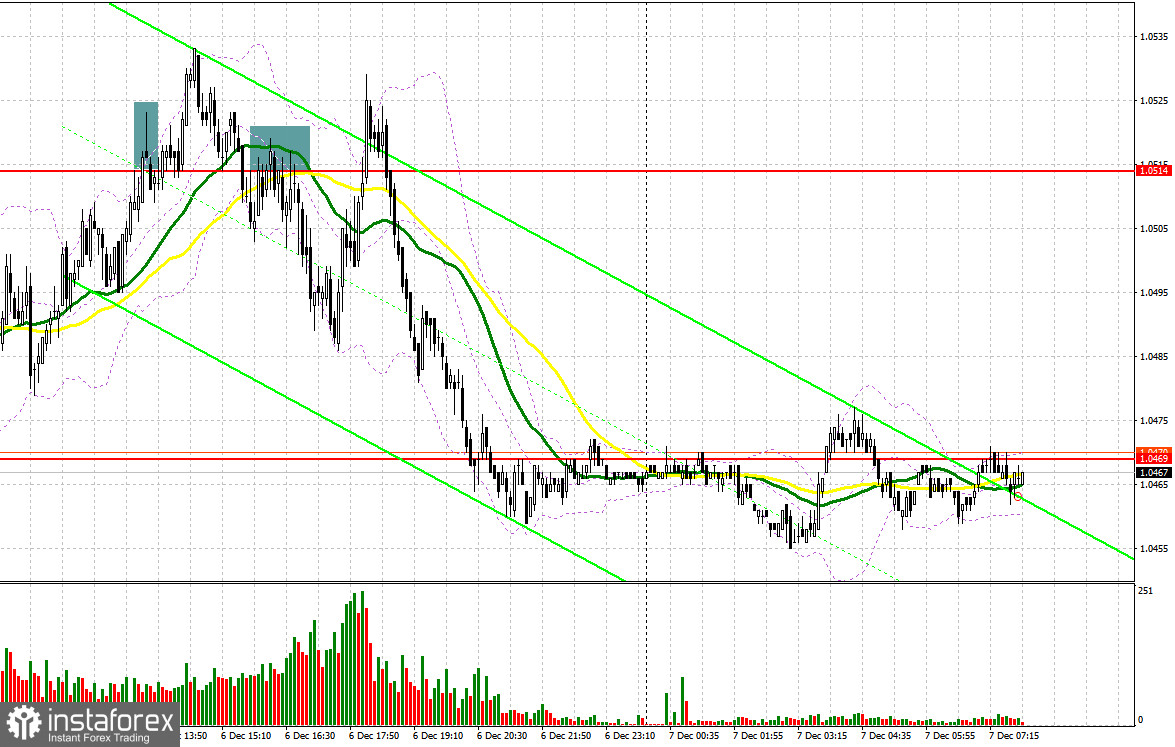
Yesterday, traders received several signals to enter the market. Let us take a look at the 5-minute chart to figure out what happened. Earlier, I asked you to pay attention to the level of 1.0514 to decide when to enter the market. Traders did not receive signals to enter the market in the first part of the day because of low volatility caused by uncertainty about further monetary policy tightening in the US. As a result, the pair failed to reach the indicated levels. In the second part of the day, a false breakout of 1.0514 led to a sell signal, which forced traders to lock in losses since the pair did not fall. Only in the middle of the US trade, traders got a sell signal after the price dropped below 1.0514 and upwardly tested this level. As a result, the pair slid by 30 pips.
Conditions for opening long positions on EUR/USD:
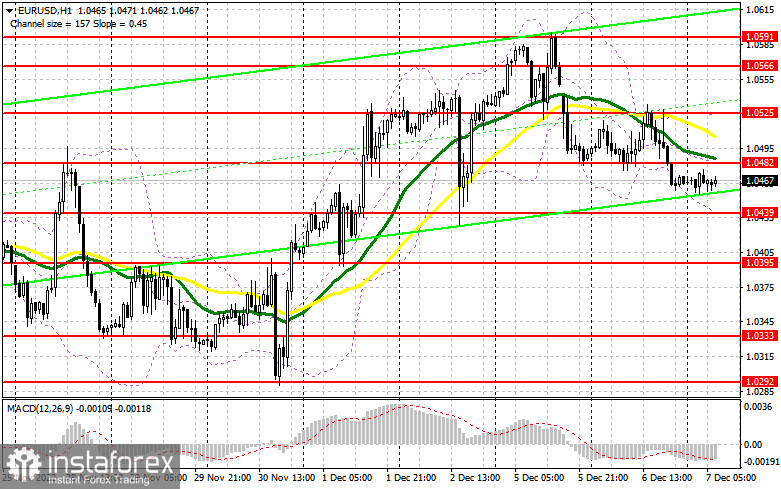
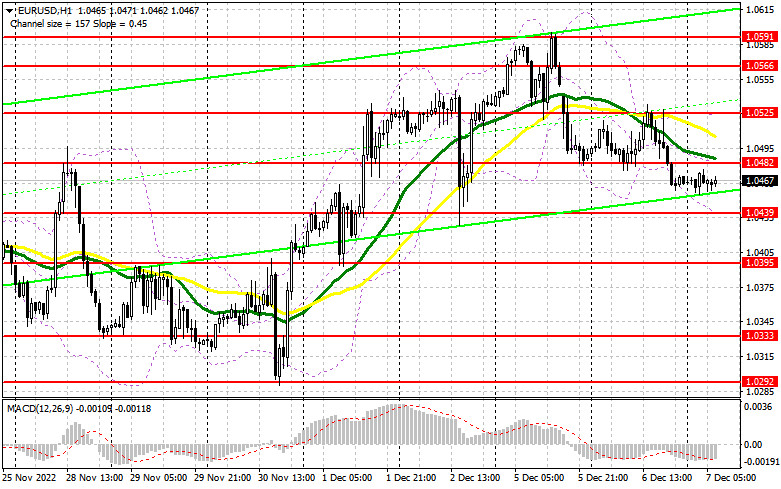
The euro was supported by rumors about the ECB's QT program and the loosening of Covid-19 restrictions in China. However, that was not enough. Some analysts suppose that next week, the Fed is unlikely to remain as dovish as it was before. This, in turn, may boost the greenback. Today's data on Germany's industrial production, the eurozone GDP for the third quarter, and the eurozone employment data may exert additional pressure on the pair in the first part of the day. If the data is downwardly revised, economists will get signs of real economic problems. If the euro drops in the first part of the day amid weak data, a false breakout of the nearest support level of 1.0439 will give a buy signal, thus pushing the price to 1.0484. Slightly above this level, there are bearish MAs. A breakout and downward test of this area will give an additional entry point with the target at the high of 1.0525. In this case, the bullish sentiment is likely to prevail. A breakout of this level will affect bears' stop orders and form one more buy signal with the target at 1.0566, where it is recommended to lock in profits. If the euro/dollar pair declines and bulls fail to protect 1.0439, pressure on the pair will remain in force. This may create prerequisites for the end of the bullish trend seen since November. A breakout of 1.0439 will allow the pair to slide to the support level of 1.0395. Traders may go long from this level only after a false breakout. It is also possible to buy the asset just after a bounce off 1.0333 or even lower – from 1.0292, expecting a rise of 30-35 pips within the day.
Conditions for opening short positions on EUR/USD:
Sellers of the euro remain active and open more short orders amid any rise in the asset. Today, bears should primarily protect the nearest resistance level of 1.0482 and gain control over 1.0439. A rise and a false breakout of 1.0482 amid the data from the eurozone will give a perfect sell signal. At the same time, speeches that will be provided by ECB's Lane and Panetta may intensify pressure on the pair, thus causing a decline to 1.0439. A breakout and a test of this level will give an additional sell signal with the target at 1.0395. If the price settles below this level, it may slide to 1.0333, where it is recommended to lock in profits. The farthest target is located at 1.0292. If the pair touches this level, the uptrend, which began in November, will end. If the euro/dollar pair increase during the European session and bears fail to protect 1.0482, the price may jump to 1.0525. There, traders may also go short only after an unsuccessful settlement. It is also possible to sell the asset just after a rebound from the high of 1.0566, expecting a decline of 30-35 pips.
COT report
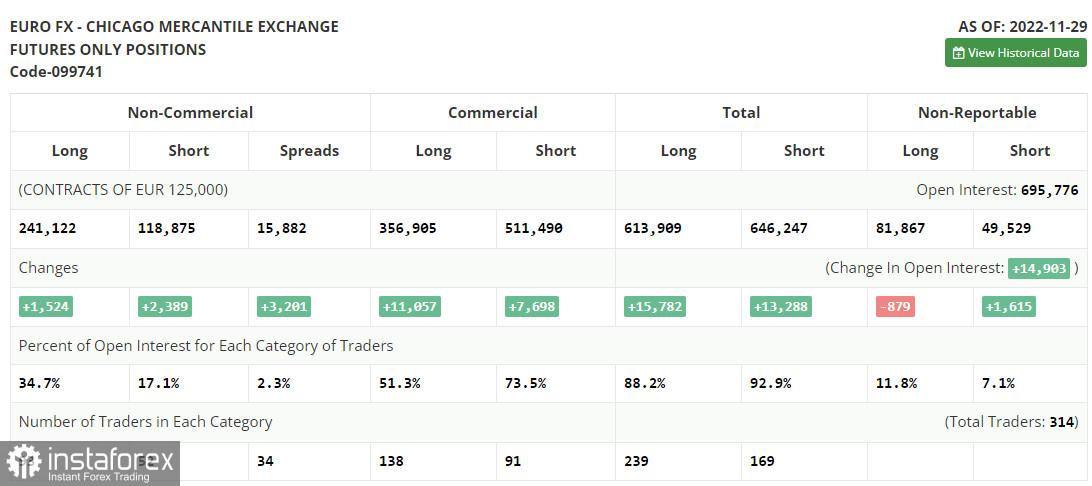
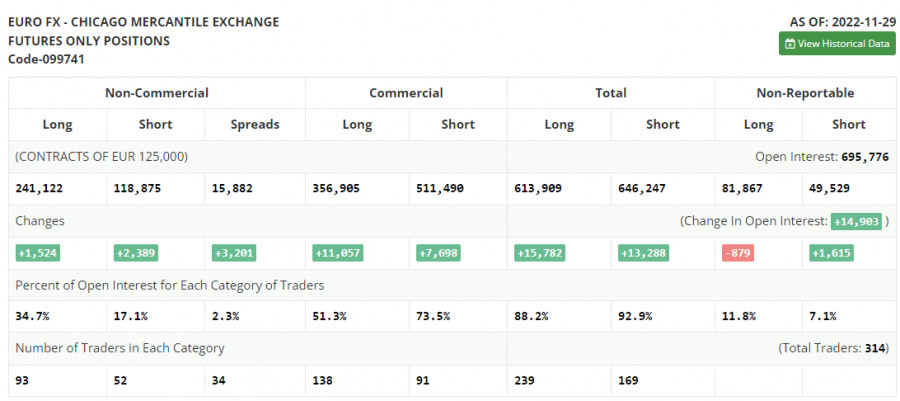
According to the COT report from November 29, the number of both long and short positions increased. Announcements made by Jerome Powell last week retained demand for risk assets, including the euro. Since the pair has been confidently rising since November, there are a lot of traders who prefer selling at the current levels. Recent fundamental data from the US, namely, business activity and labor market indicators, allowed traders to bet on a longer period of higher interest rates in the US in the upcoming year. Against the backdrop, there is no good reason to open long positions in the mid term. The higher the euro climbs, the deeper it will fall. The week is expected to be calm and traders are likely to shift their attention to the FOMC meeting, which is scheduled for December 13-14. According to the COT report, the number of long non-commercial positions increased by 1,524 to 241,122, whereas the number of short non-commercial positions jumped by 2,389 to 118,875. At the end of the week, the total non-commercial net position decreased slightly to 122,234 from 123,112. This indicates that investors are no longer in such a hurry to buy back the euro since it is not as cheap as it was a few months earlier. The weekly closing price advanced to 1.0342 from 1.0315.
Signals of indicators:
Moving Averages
Trading is performed below 30- and 50-day moving averages, which points to a drop in the euro.
Note: The period and prices of moving averages are considered by the author on the one-hour chart which differs from the general definition of the classic daily moving averages on the daily chart.
Bollinger Bands
If the pair advances, a resistance level could be seen at 1.0525, the upper limit of the indicator. In case of a decline, the lower limit of the indicator located at 1.0439 will act as support.
Description of indicators
- Moving average (moving average, determines the current trend by smoothing volatility and noise). The period is 50. It is marked in yellow on the chart.
- Moving average (moving average, determines the current trend by smoothing volatility and noise). The period is 30. It is marked in green on the graph.
- MACD indicator (Moving Average Convergence/Divergence - convergence/divergence of moving averages). A fast EMA period is 12. A slow EMA period is 26. The SMA period is 9.
- Bollinger Bands. The period is 20.
- Non-profit speculative traders are individual traders, hedge funds, and large institutions that use the futures market for speculative purposes and meet certain requirements.
- Long non-commercial positions are the total number of long positions opened by non-commercial traders.
- Short non-commercial positions are the total number of short positions opened by non-commercial traders.
- The total non-commercial net position is a difference in the number of short and long positions opened by non-commercial traders.