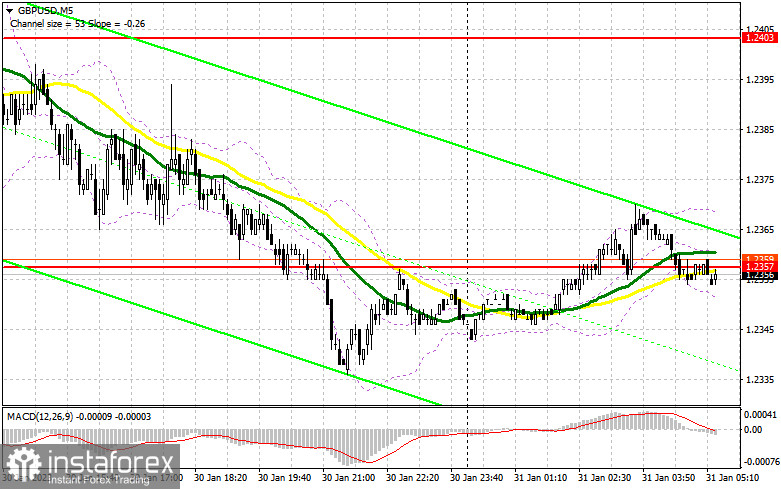
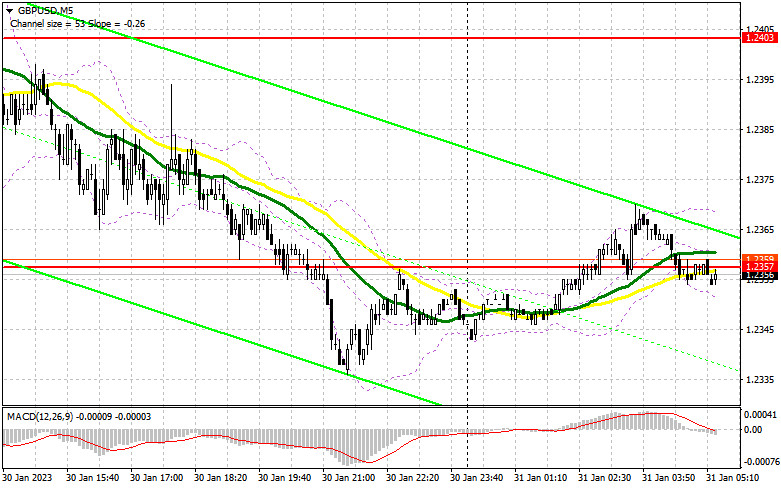
Yesterday, there were no signals to enter the market. Let's take a look at the 5-minute chart and figure out what happened there. During the European session, we failed to see updates of the nearest levels due to low volatility. During the US session, even though there was a test of the resistance at 1.2403, we didn't get any normal signals. For today, the technical picture has been completely revised.
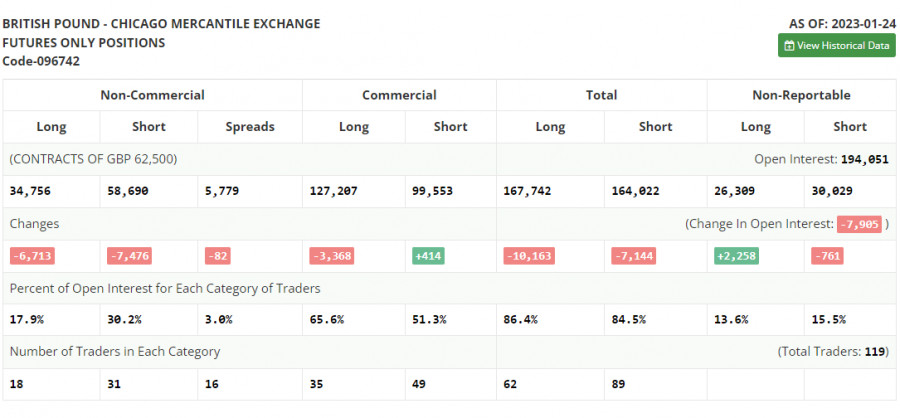
Before we conduct technical analysis, let's look at the situation in the futures market. The COT report for January 24 logged a plunge in both long and short positions. However, this drop was within the limits, especially if taking into account the problems the UK is now facing. Its government has to deal with strikes for fair pay and fight against stubborn inflation at the same time. Nevertheless, all eyes are now on the upcoming meetings of the US Fed and the Bank of England. The American regulator is expected to adopt a less aggressive stance on monetary policy. Meanwhile, its British counterpart is likely to stay hawkish and raise the interest rate by 0.5%. In this light, the pound sterling may strengthen unless something extraordinary happens. According to the latest COT report, short non-commercial positions decreased by 7,476 to 58,690, and long non-commercial positions fell by 6,713 to 34,756. As a result, the non-commercial net position came in at -23,934 versus -24,697 a week ago. These are insignificant changes. Therefore, they are unlikely to affect market sentiment. That is why it is important to monitor macroeconomic reports in the UK and the BoE's rate decisions. The weekly closing price rose to 1.2350 from 1.2290.
Conditions for opening long positions on GBP/USD:
The pound trades with very low volatility, and it is usually difficult to make correct decisions in such conditions. This is the reason why I try not to look for close entry points, but focus on larger levels, which we have not reached lately. A couple of reports from the UK will be released today, and I don't think they are important. These are reports on the change of M4 money aggregate, the number of approved mortgage applications and the volume of net loans to individuals in the UK. This is past the currency market, so the pair could start a correction ahead of the Federal Reserve and the Bank of England meetings.
A false breakout of 1.2312, which is the nearest support, will provide a buy signal and confirm the bulls' presence. This will provide an opportunity to go back to 1.2379. This is also the level where the bearish moving averages pass. Without this level, it will be difficult for the bulls to build a new uptrend. We can expect GBP to rise further, if it climbs above the aforementioned level amid strong UK reports. Afterwards, a breakout of 1.2379 and a downward test can push the price to 1.24441, which is this month's high and where I recommend locking in profits. The farthest target is located at 1.2487. If the quote hits the mark, selling pressure may decrease. If GBP/USD goes down and there is no bullish activity at 1.2312, the balance in the market will be lost, and the bears will push the pair down. In such a case, long positions could be opened after a false breakout through 1.2266. It will also become possible to buy GBP/USD on a rebound from 1.2172, allowing a correction of 30 to 35 pips intraday.
Conditions for opening short positions on GBP/USD:
Yesterday, the bears managed to recapture the monthly highs and they couldn't update them, which shows that the pair is locked in a sideways channel ahead of the central bank meetings. Now the bears have a good chance to build a bigger correction, but they need weak fundamental reports in order to do so. The downtrend may extend if the pair breaks below 1.2312, which may take place already in the first half of the day. But before we expect a continuation of the downtrend, it would be good to fight back around 1.2379, which will allow the bears to prove their presence in the market.
If GBP/USD goes up after the data, a false breakout through 1.2379 will make a sell signal with the target at the nearest support level of 1.2312. A breakout and a retest of this mark to the upside will create a sell entry point with the target at 1.2266. A more distant target is seen at 1.2172 where it is wiser to lock in profits. In case of growth in GBP/USD and the absence of the bears at 1.2379, the bulls will take the upper hand, which will lead to a breakout through the high of 1.2444. A false breakout of this level will give an entry point into short positions with the aim of moving down. If traders aren't active there either, you could sell GBP/USD at a bounce from a high of 1.2487, keeping in mind a downward intraday correction of 30-35 pips.
Signals of indicators:
Moving Averages
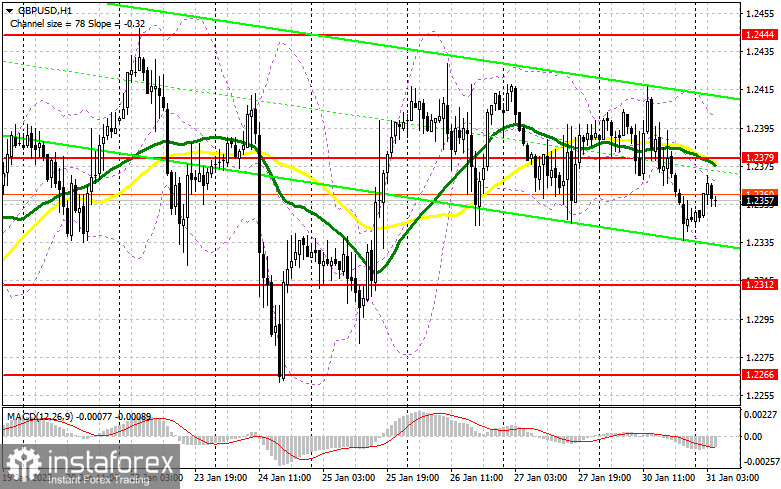
Trading is performed below the 30- and 50-day moving averages, which shows that the bears are trying to build a correction.
Note: The author considers the period and prices of moving averages on the one-hour chart which differs from the general definition of the classic daily moving averages on the daily chart.
Bollinger Bands
In case of growth, the upper limit of the indicator at 1.2410 will act as resistance. In case the pair falls, the lower limit of the indicator located at 1.2330 will act as support.
Description of indicators
- Moving average (a moving average determines the current trend by smoothing volatility and noise). The period is 50. It is marked in yellow on the chart.
- Moving average (a moving average determines the current trend by smoothing volatility and noise). The period is 30. It is marked in green on the graph.
- MACD indicator (Moving Average Convergence/Divergence - convergence/divergence of moving averages). A fast EMA period is 12. A slow EMA period is 26. The SMA period is 9.
- Bollinger Bands. The period is 20.
- Non-profit speculative traders are individual traders, hedge funds, and large institutions that use the futures market for speculative purposes and meet certain requirements.
- Long non-commercial positions are the total number of long positions opened by non-commercial traders.
- Short non-commercial positions are the total number of short positions opened by non-commercial traders.
- The total non-commercial net position is a difference in the number of short and long positions opened by non-commercial traders.