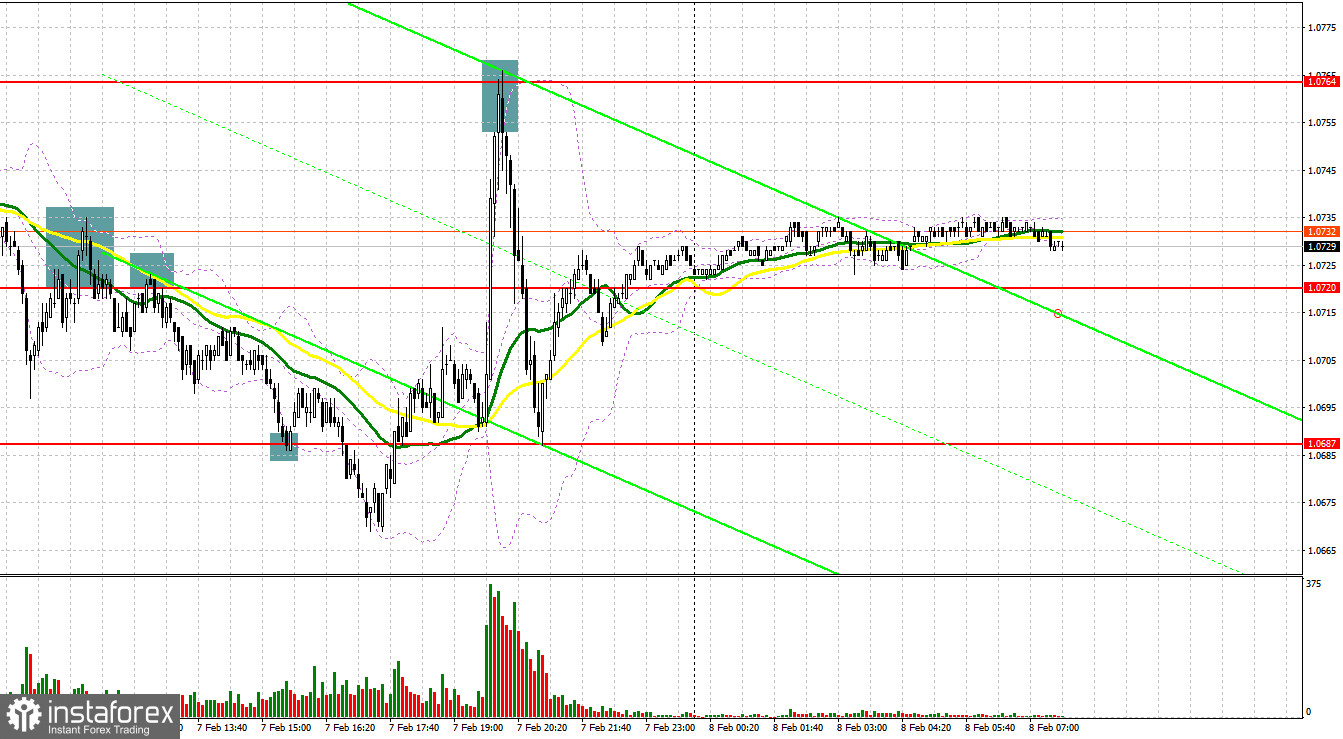
Yesterday, traders received quite many profitable signals to enter the market. Let us take a look at the 5-minute chart to clear up the market situation. Earlier, I asked you to pay attention to the level of 1.0720 to decide when to enter the market. A breakout and an upward test of 1.0720 led to a sell signal. As a result, the euro dropped by more than 30 pips. In the second part of the day, bulls protected 1.0687. However, the pair did not rise considerably. Only in the middle of the US session, traders got a perfect sell signal after a false breakout of 1.0764, which led to a drop of more than 75 pips.
Conditions for opening long positions on EUR/USD:
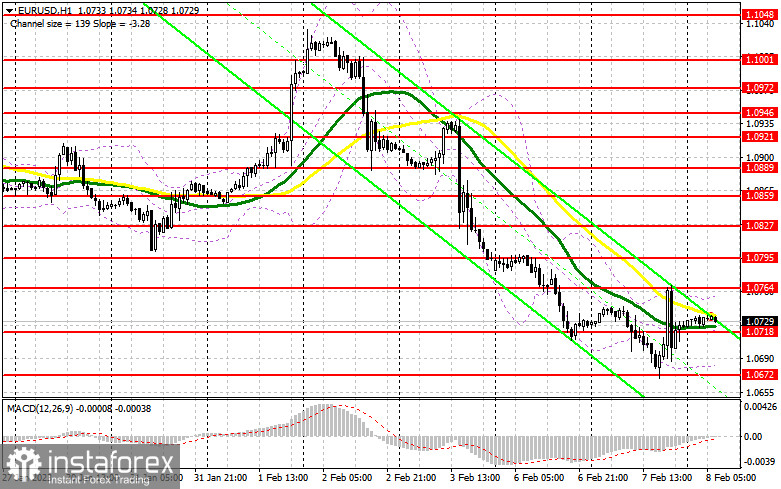
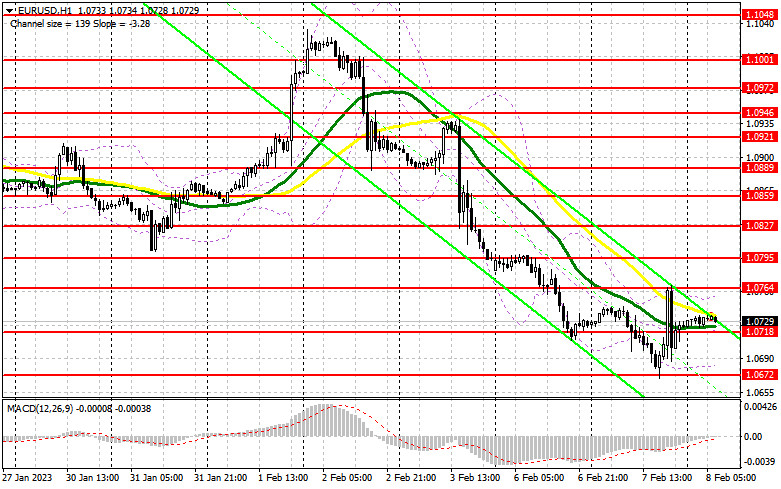
Yesterday, all eyes were turned to Fed's Chair Jerome Powell. He said once again that the key rate could be higher than expected since the US labor market continued to shape the regulator's stance. This led to a sharp drop in risk assets and the US dollar appreciation. That is why the currency is unlikely to reach the bottom of the bearish market. Today, we will hardly get information that could support the euro in the first part of the day. Italy is going to disclose data on the changes in the private payrolls. France will publish its retail sales figures. What is more, Member of the Executive Board of the ECB Frank Elderson will deliver a speech. He is expected to support a less hawkish stance on monetary policy. If the euro/dollar pair declines like yesterday, bulls will have to protect the nearest support level of 1.0718. Only a false breakout of this level will allow traders to buy the euro with the target at 1.0764. Slightly below this level, there are bearish MAs. A breakout and a downward test of this level will give an additional long signal with the target at 1.0795. A breakout of this level will affect the stop orders of bears and give one more signal with the target at 1.0827, where it is better to lock in profits. However, we will hardly see such a rapid rise. If the euro/dollar pair declines and buyers fail to protect 1.0718 in the first part of the day, pressure on the pair will remain intact. Traders will focus on the next support level of 1.0672. Only a false breakout of this level will lead to a buy signal. Traders may go long just after a bounce off the low of 1.0618 and even lower – from 1.0569, expecting a rise of 30-35 pips.
Conditions for opening short positions on EUR/USD:
Yesterday, Fed Chair Jerome Powell allowed sellers of the euro to enter the market. On the MACD indicator, we see that yesterday's divergence is over and bears may launch a new downward wave. Traders may sell the asset from 1.0764, but they should make sure that big traders are in the market. A rise and a false breakout will give a sell signal with the target at 1.0718, an intermediate support level formed yesterday. A breakout and a reverse test of this area will give an additional sell signal with the target at 1.0672, which may accelerate the downward correction. A settlement below this area amid weak data from the eurozone will push the price lower to 1.0618, where it will be wise to lock in profits. If the euro/dollar pair increases during the European session and bears fail to protect 1.0764, bulls will try to regain control over the market. In this case, it is better to avoid selling until the price hits 1.0795, where it is possible to sell after an unsuccessful settlement. Traders may also go short just after a rebound from the high of 1.0827, expecting a decline of 30-35 pips.
COT report
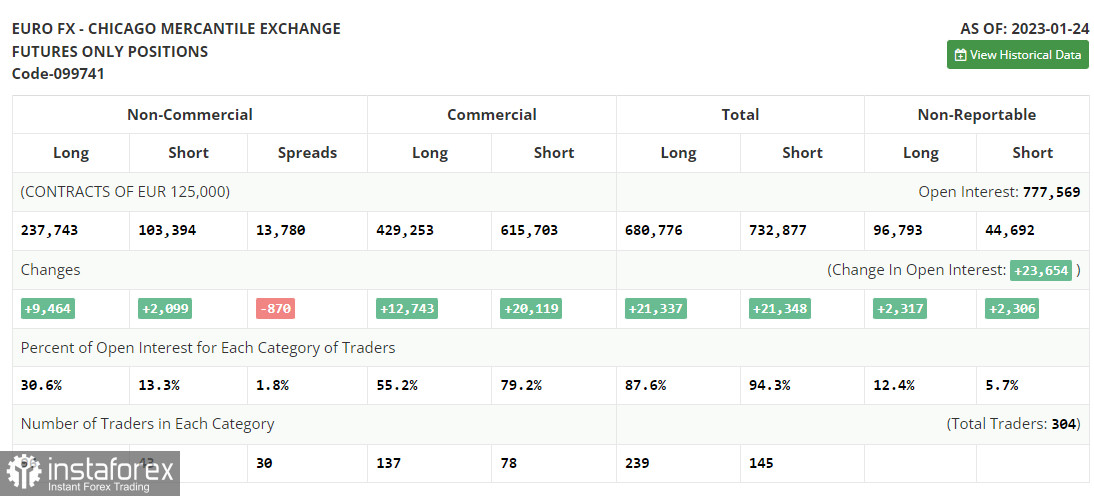
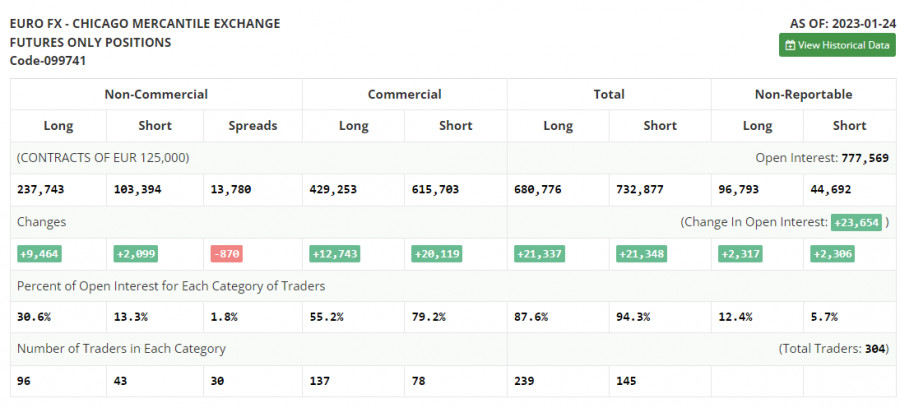
The COT report for January 24 logged a rise in both short and long positions. Traders have significantly increased long positions following hawkish speeches of ECB policymakers. They are betting on further monetary tightening by the ECB and the Fed's dovish stance. The US regulator may reduce the pace of tightening for the second time in a row. Weak macro stats on the US economy, namely a drop in retail sales and a slowdown in inflation may force the central bank to take a pause in rate hikes to avoid any damage. This week, several central banks will hold their meetings. Their results will eventually determine the trajectory of the euro/dollar pair. According to the COT report, the number of long positions of the non-commercial group of traders increased by 9,464 to 237,743 while the number of short positions advanced by 2,099 to 103,394. At the end of the week, the total non-commercial net position rose to 134,349 from 126,984. It appears investors believe in the upside potential of the euro. Nevertheless, they are waiting for more clues from central banks regarding interest rates. The weekly closing price grew to 1.0919 from 1.0833.
Signals of indicators:
Moving Averages
Trading is performed slightly below 30- and 50-day moving averages, which points to a further decline in the pair.
Note: The author considers the period and prices of moving averages on the one-hour chart which differs from the general definition of the classic daily moving averages on the daily chart.
Bollinger Bands
If the pair increases, the resistance level will be formed by the upper limit of the indicator located at 1.0764. In case of a decline, the lower limit of the indicator located at 1.0680 will act as support.
Description of indicators
- Moving average (a moving average determines the current trend by smoothing volatility and noise). The period is 50. It is marked in yellow on the chart.
- Moving average (a moving average determines the current trend by smoothing volatility and noise). The period is 30. It is marked in green on the graph.
- MACD indicator (Moving Average Convergence/Divergence - convergence/divergence of moving averages). A fast EMA period is 12. A slow EMA period is 26. The SMA period is 9.
- Bollinger Bands. The period is 20.
- Non-profit speculative traders are individual traders, hedge funds, and large institutions that use the futures market for speculative purposes and meet certain requirements.
- Long non-commercial positions are the total number of long positions opened by non-commercial traders.
- Short non-commercial positions are the total number of short positions opened by non-commercial traders.
- The total non-commercial net position is a difference in the number of short and long positions opened by non-commercial traders.