empty
 
 
24.03.2023 10:21 AM
EUR/USD and GBP/USD: trading plan for beginners on March 24, 2023

Macroeconomic calendar from March 23

At a monetary policy meeting yesterday, the Bank of England raised interest rates by 25 basis points to 4.25%, the highest rates since October 2008. Back then, interest rates were at 4.50%. The increase came due to persistent inflation. In February and January, consumer prices accelerated to 10.4% and 10.1% respectively. Meanwhile, economists had expected inflation to slow down in February. However, the latest press release hints at a possible end of the tightening cycle in the near term. So, it may be that we will soon see the regulator pause tightening.

Overview of technical charts from March 23

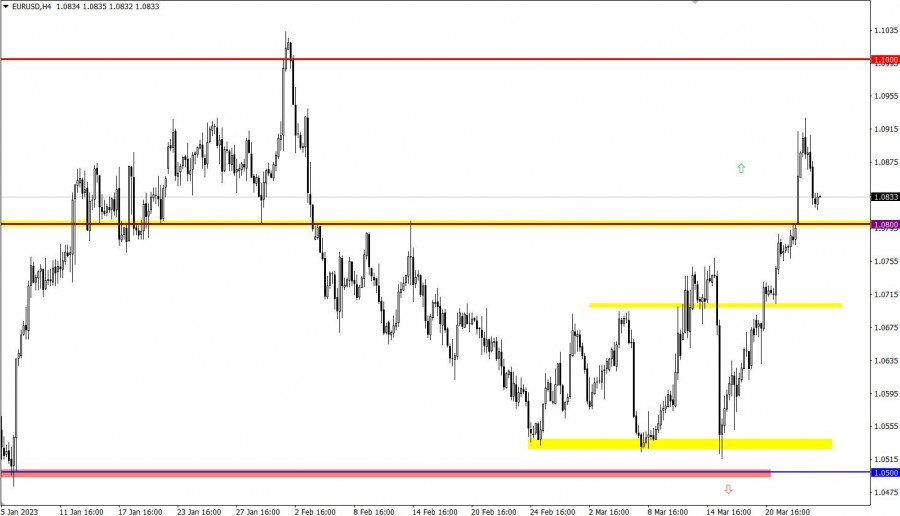
EUR/USD has gained over 250 pips since the beginning of the week. That triggered a horizontal movement with a signal to buy EUR. The volume of long positions decreased and the price retreated.

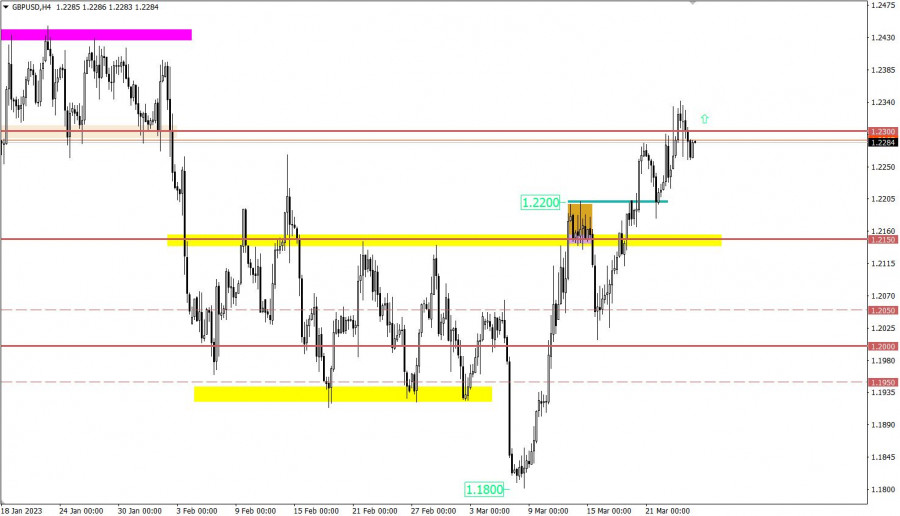
Once 1.2300 resistance was reached, GBP/USD pulled back somewhat. Nevertheless, the bull trend goes on. The pound has recouped almost all losses incurred in February.

This image is no longer relevant

Macroeconomic calendar on March 24

With the opening of European trade, UK retail sales came in, showing a rise to -3.5% versus -5.4% year-on-year. On a monthly basis, figures grew by 1.2%.

Today, a series of business activity reports will be delivered in the eurozone, the United States, and the United Kingdom. Economists expect figures to decline across the board.

Trading plan for EUR/USD on March 24

EUR/USD retreated to 1.0800 support. The price may rebound from this mark with a rise in buying volumes.

Alternatively, EUR/USD may go down if quotes stay below 1.0800 intraday.

This image is no longer relevant

Trading plan for GBP/USD on March 24

A pullback may cause a shift in sentiment. Should the price go above 1.2300, it would generate a signal to buy GBP. This could lead to a bullish continuation, and the pair could update the swing high of the medium-term trend.

Alternatively, if quotes fall below 1.2200, it will mark the rise of a downtrend.

This image is no longer relevant

What's on technical charts

The candlestick chart shows graphical white and black rectangles with upward and downward lines. While conducting a detailed analysis of each individual candlestick, it is possible to notice its features intrinsic to a particular time frame: the opening price, the closing price, and the highest and lowest price.

Horizontal levels are price levels, in relation to which a stop or reversal of the price may occur. They are called support and resistance levels.

Circles and rectangles are highlighted examples where the price reversed in the course of its history. This color highlighting indicates horizontal lines which can exert pressure on prices in the future.

Upward/downward arrows signal a possible future price direction.

Gven Podolsky,
Analytical expert of InstaForex
© 2007-2024
Earn on cryptocurrency rate changes with InstaForex
Download MetaTrader 4 and open your first trade
  • Grand Choice
    Contest by
    InstaForex
    InstaForex always strives to help you
    fulfill your biggest dreams.
    JOIN CONTEST
  • Chancy Deposit
    Deposit your account with $3,000 and get $3000 more!
    In September we raffle $3000 within the Chancy Deposit campaign!
    Get a chance to win by depositing $3,000 to a trading account. Having fulfilled this condition, you become a campaign participant.
    JOIN CONTEST
  • Trade Wise, Win Device
    Top up your account with at least $500, sign up for the contest, and get a chance to win mobile devices.
    JOIN CONTEST
  • 100% Bonus
    Your unique opportunity to get a 100% bonus on your deposit
    GET BONUS
  • 55% Bonus
    Apply for a 55% bonus on your every deposit
    GET BONUS
  • 30% Bonus
    Receive a 30% bonus every time you top up your account
    GET BONUS

Recommended Stories

Can't speak right now?
Ask your question in the chat.
Widget callback