Analyzing Wednesday's trades:
GBP/USD on 30M chart
GBP/USD tried to break through 1.2343 on Wednesday, but failed to do so for the third time. We consider this level to be very important, because the last spiral of the upward movement ended near it a week ago. Thus, failure to break through this level might provoke a new round of decline for the pound. I firmly believe that the pound should fall because it is the most reasonable and logical scenario. Recall that a week ago, the price settled below the uptrend line, which we couldn't even rebuild for new movements. A sell signal was formed and was quite strong, but traders still refused to sell. This week there were no important events, except for Bank of England Governor Andrew Bailey's speech, who was very modest in his comments, as usual. Anyway, the volatility of the pair is very weak, and the character of the movement leaves much to be desired. Just like how it was with the EUR/USD pair.
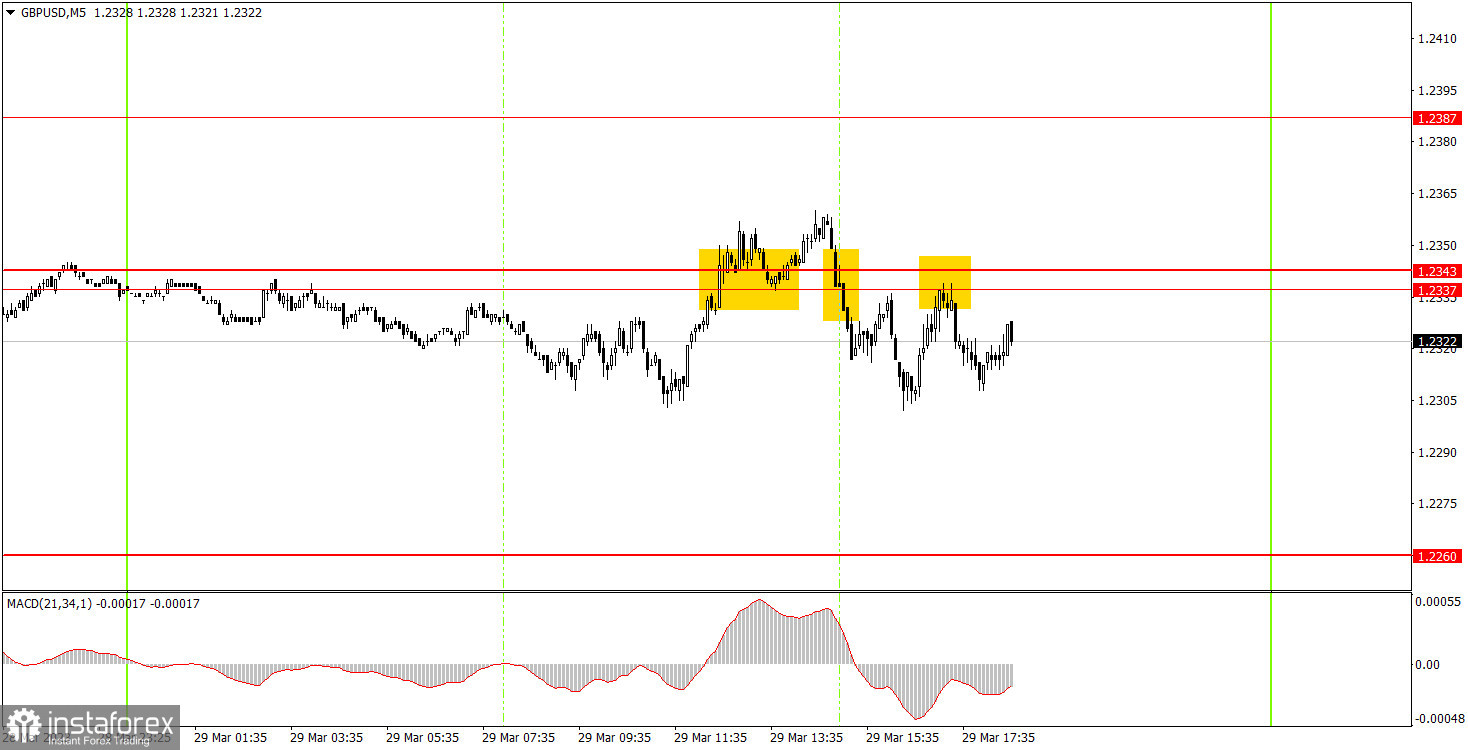
GBP/USD on 5M chart
On the 5-minute chart, the trading signals were a complete disappointment. All of them were formed near the area of 1.2337-1.2343, and of course, they turned out to be false. First, the pair broke through this area, then it overcame it in the opposite direction, and then it bounced from the bottom. In the first case, it failed to go even 10 points in the necessary direction, in the second case, it gained 20 points. Therefore, on the second short position, the Stop Loss should have been set to Breakeven, and there was a small loss on the first long position. The third signal should not be used.
Trading tips on Thursday:
On the 30-minute chart, GBP/USD continues to trade in the classic "swing", but in the long term. After several weeks of growth, we have long been waiting for the pair to enter a bearish correction. But the market still refuses to sell. A new round of decline may start from 1.2343, but overcoming this level will restore the uptrend. On the 5-minute chart, it is recommended to trade at the levels 1.1924, 1.1992-1.2008, 1.2065-1.2079, 1.2143, 1.2171-1.2179, 1.2245-1.2260, 1.2337-1.2343, 1.2387, 1.2444-1.2471. As soon as the price passes 20 pips in the right direction, you should set a Stop Loss to breakeven. There are no important events or reports scheduled in the UK. In America, the GDP report for the fourth quarter is not that important. But traders may still react to it since the economic calendar has been empty.
Basic rules of the trading system:
1) The strength of the signal is determined by the time it took the signal to form (a rebound or a breakout of the level). The quicker it is formed, the stronger the signal is.
2) If two or more positions were opened near a certain level based on a false signal (which did not trigger a Take Profit or test the nearest target level), then all subsequent signals at this level should be ignored.
3) When trading flat, a pair can form multiple false signals or not form them at all. In any case, it is better to stop trading at the first sign of a flat movement.
4) Trades should be opened in the period between the start of the European session and the middle of the US trading hours when all positions must be closed manually.
5) You can trade using signals from the MACD indicator on the 30-minute time frame only amid strong volatility and a clear trend that should be confirmed by a trendline or a trend channel.
6) If two levels are located too close to each other (from 5 to 15 pips), they should be considered support and resistance levels.
On the chart:
Support and Resistance levels are the levels that serve as targets when buying or selling the pair. You can place Take Profit near these levels.
Red lines are channels or trend lines that display the current trend and show in which direction it is better to trade now.
The MACD indicator (14, 22, and 3) consists of a histogram and a signal line. When they cross, this is a signal to enter the market. It is recommended to use this indicator in combination with trend patterns (channels and trendlines).
Important announcements and economic reports that can be found on the economic calendar can seriously influence the trajectory of a currency pair. Therefore, at the time of their release, we recommend trading as carefully as possible or exiting the market in order to avoid sharp price fluctuations.
Beginners on Forex should remember that not every single trade has to be profitable. The development of a clear strategy and money management is the key to success in trading over a long period of time.