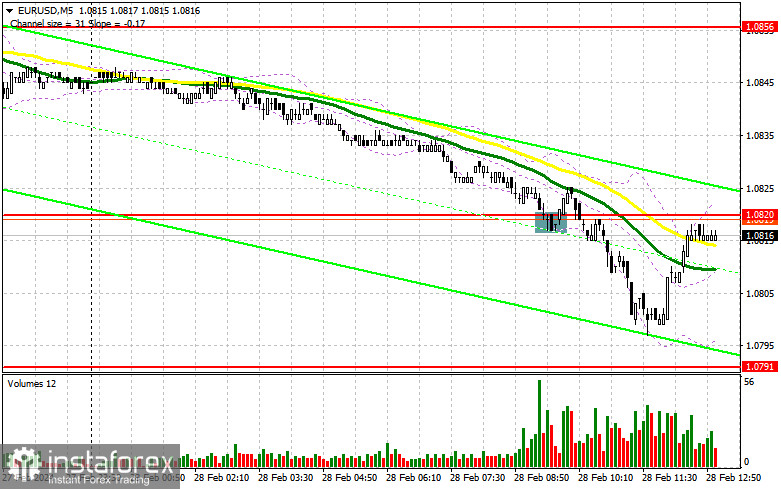
In my morning forecast, I paid attention to the level of 1.0820 and planned to make decisions on entering the market from there. Now, let's look at the 5-minute chart and understand what happened there. The decline and a false breakout there generated a buy signal, but the instrument did not actually grew, which resulted in activating stop losses. In the afternoon, the technical picture was revised.
What is needed to open long positions on EUR/USD
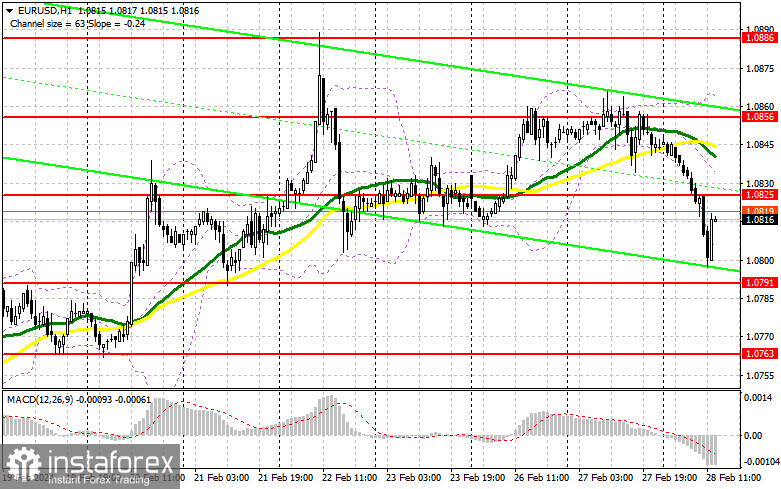
The empty economic calendar, as expected, led to a decline in the euro today in the first half of the day, especially after unsuccessful attempts yesterday to break beyond the weekly high. Fairly mediocre data on the US GDP for the fourth quarter of 2023 is to be published later today. It's unlikely that the data will be significantly revised, so the chances for euro buyers are quite slim. If the GDP turns out to be worse than the preliminary data, then demand for the euro will return. However, FOMC members Raphael Bostic and John Williams are sure to speak in a hawkish tone. So, here too, such fundamentals are not in favor of the buyers of risky assets. In case of the decent GDP readings that will push the euro down, I will enter the market after a false breakout near the closest support at 1.0791, which will be a suitable condition for buying. I would reckon a rise to the area of 1.0825, new resistance formed in the first half of the day. A breakout and a top-down test of this range will give a chance for buying, aiming for a surge to 1.0856. The highest target will be the high of 1.0886, where I will be taking profits. In the scenario of a EUR/USD decline and no activity at 1.0791 in the second half of the day, which will only happen in the case of very strong US statistics, the instrument will come under selling pressure again. This will enable a more significant decrease in the euro. In this case, I plan to enter the market only after a false breakout near 1.0763. I will open long positions immediately on a dip from 1.0735, bearing in mind an upward correction of 30-35 pips within the day.
What is needed to open short positions on EUR/USD
The bears have insisted on a more significant correction of EUR/USD. From here on, everything will depend on the US data and statements from the Federal Reserve's policymakers. Poor statistics will lead to a rise in the instrument in the second half of the day. Only a false breakout around 1.0825 will suggest selling following the downtrend towards the support area of 1.0791, which has not been reached today. A breakout and consolidation below this range, as well as a reverse test from below upwards, will provide another point for selling, suggesting a collapse of EUR/USD to the area of 1.0763. This will create the conditions for a bear market. The deepest target will be the low of 1.0735, where I will be taking profits. In case of an upward movement of EUR/USD during the American session, and the absence of the bears at 1.0825, the buyers will try to take back control of the market. In such a case, I will postpone selling until the test of the next resistance at 1.0856. There, I will also sell, but only after an unsuccessful consolidation. I plan to open short positions immediately on a rebound from 1.0886, aiming for a downward intraday correction of 30-35 pips.
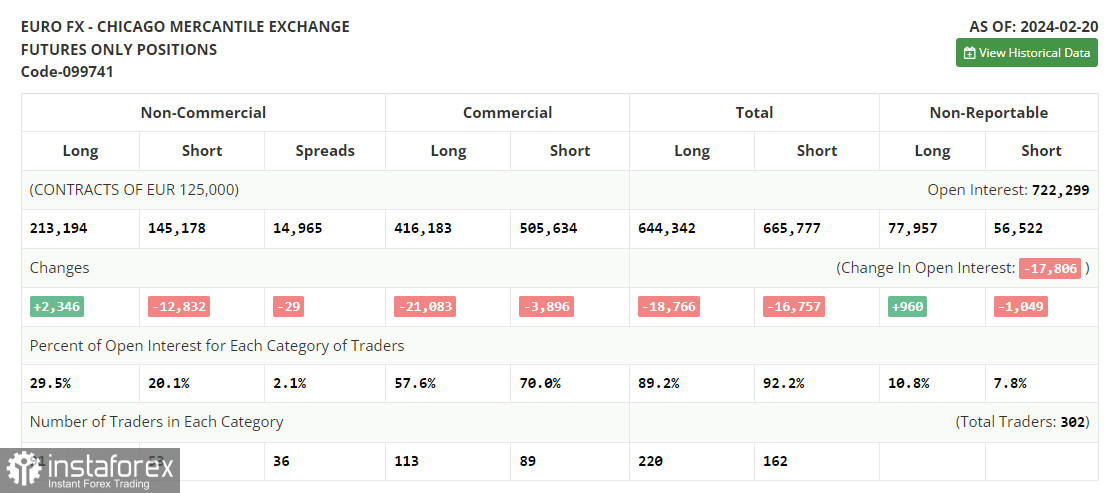
In the COT report (Commitment of Traders) for February 20th, there was an increase in long positions and a sharp reduction in short positions. Apparently, the statements from ECB policymakers had an effect, leading to a slight shift in the balance of power. However, there are still significantly more sellers, although this is a rather good signal for buyers of risky assets, especially on the back of the Federal Reserve's stance, which remains hawkish. The COT report indicates that non-commercial long positions grew by 2,346 to 213,194, while non-commercial short positions decreased by 12,832 to 145,178. As a result, the spread between long and short positions narrowed by 48.
Indicators' signals
Moving averages
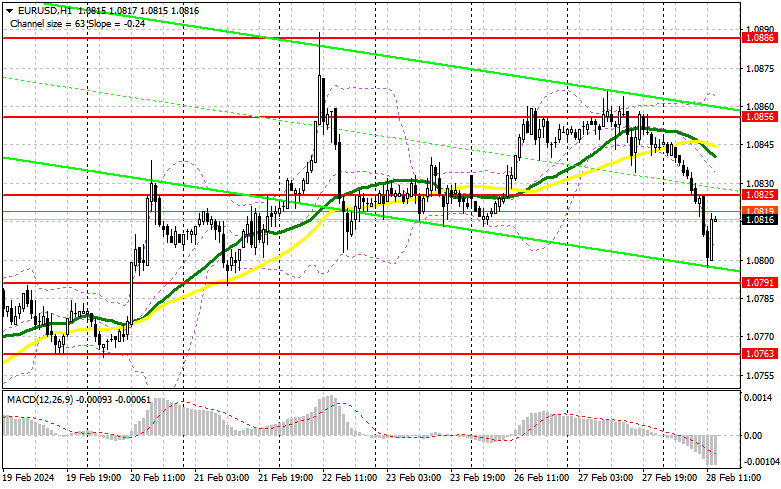
The instrument is trading below the 30 and 50-day moving averages. It indicates further weakness in the euro.
Note: The period and prices of the moving averages are considered by the analyst on the 1-hour chart and differ from the general definition of classic daily moving averages on the daily chart.
Bollinger Bands
In case EUR/USD goes down, the indicator's lower border at about 1.0800 will act as support.
Description of indicators
- Moving average (moving average, determines the current trend by smoothing out volatility and noise). Period 50. It is marked yellow on the chart.
- Moving average (moving average, determines the current trend by smoothing out volatility and noise). Period 30. It is marked green on the chart.
- MACD indicator (Moving Average Convergence/Divergence — convergence/divergence of moving averages) Quick EMA period 12. Slow EMA period to 26. SMA period 9
- Bollinger Bands (Bollinger Bands). Period 20
- Non-commercial speculative traders, such as individual traders, hedge funds, and large institutions that use the futures market for speculative purposes and meet certain requirements.
- Long non-commercial positions represent the total long open position of non-commercial traders.
- Short non-commercial positions represent the total short open position of non-commercial traders.
- Total non-commercial net position is the difference between short and long positions of non-commercial traders.