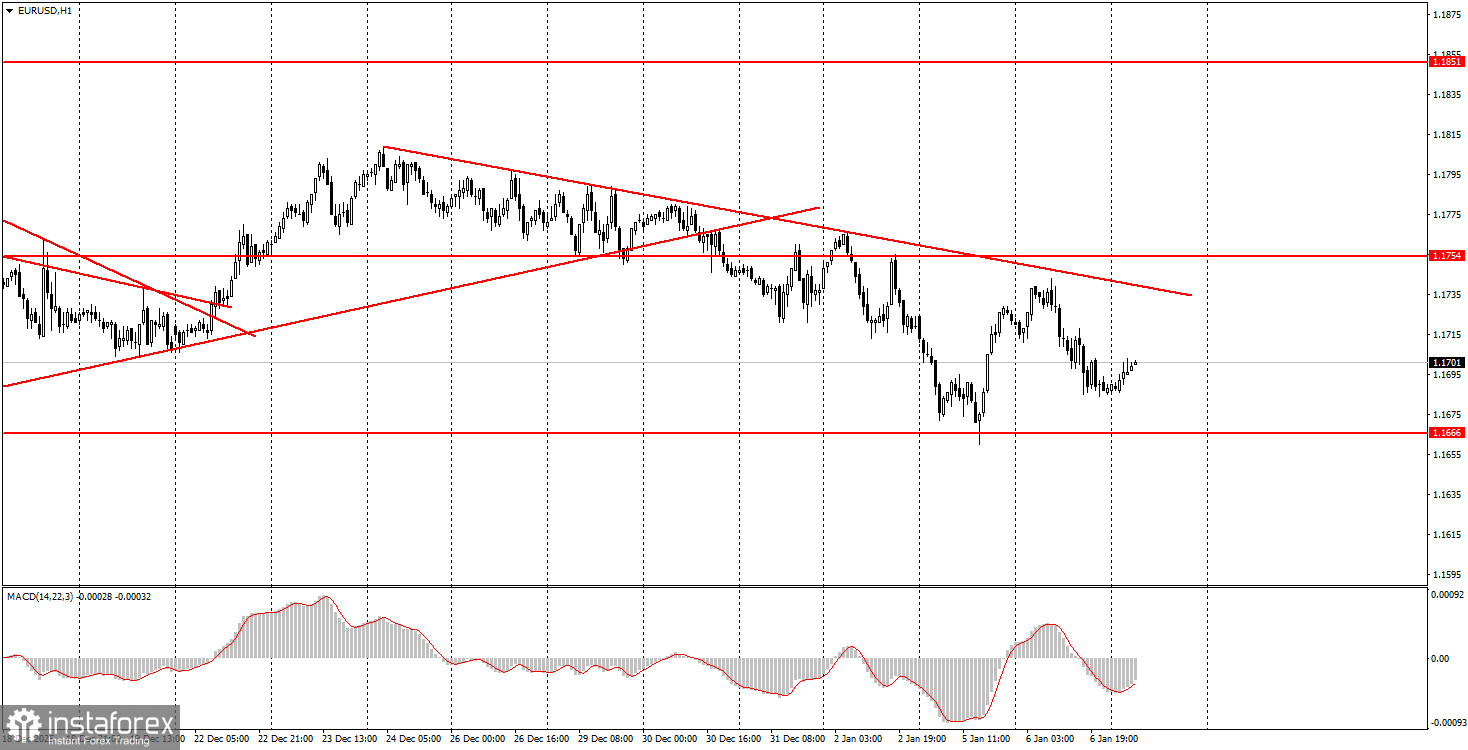
Review of Tuesday's Trades:EUR/USD 1H Chart
On Tuesday, the EUR/USD currency pair continued to trade lower, and there were reasons for that. Overall, yesterday traders could focus on just one report—the inflation report from Germany. We do not consider this report to be among the most important, since for the euro it is pan-European inflation that matters, not inflation in a single country of the bloc. Nevertheless, Germany's economy is the largest in the EU, so its data should not be completely ignored. The Consumer Price Index for December fell from 2.3% to 1.8%. Agree that a ?0.5% change is a very resonant and unexpected figure for many. What does inflation falling below 2% mean? Only that the ECB may resume a cycle of monetary policy easing. A cut in the key interest rate is a bearish factor for a currency, which is why we saw the euro fall yesterday. In addition, a downward trend remains on the hourly timeframe, so from a technical standpoint the decline was also natural. However, we do not expect it to last long. As early as today, labor market data from the United States will begin to arrive, which could have a very negative impact on the dollar.
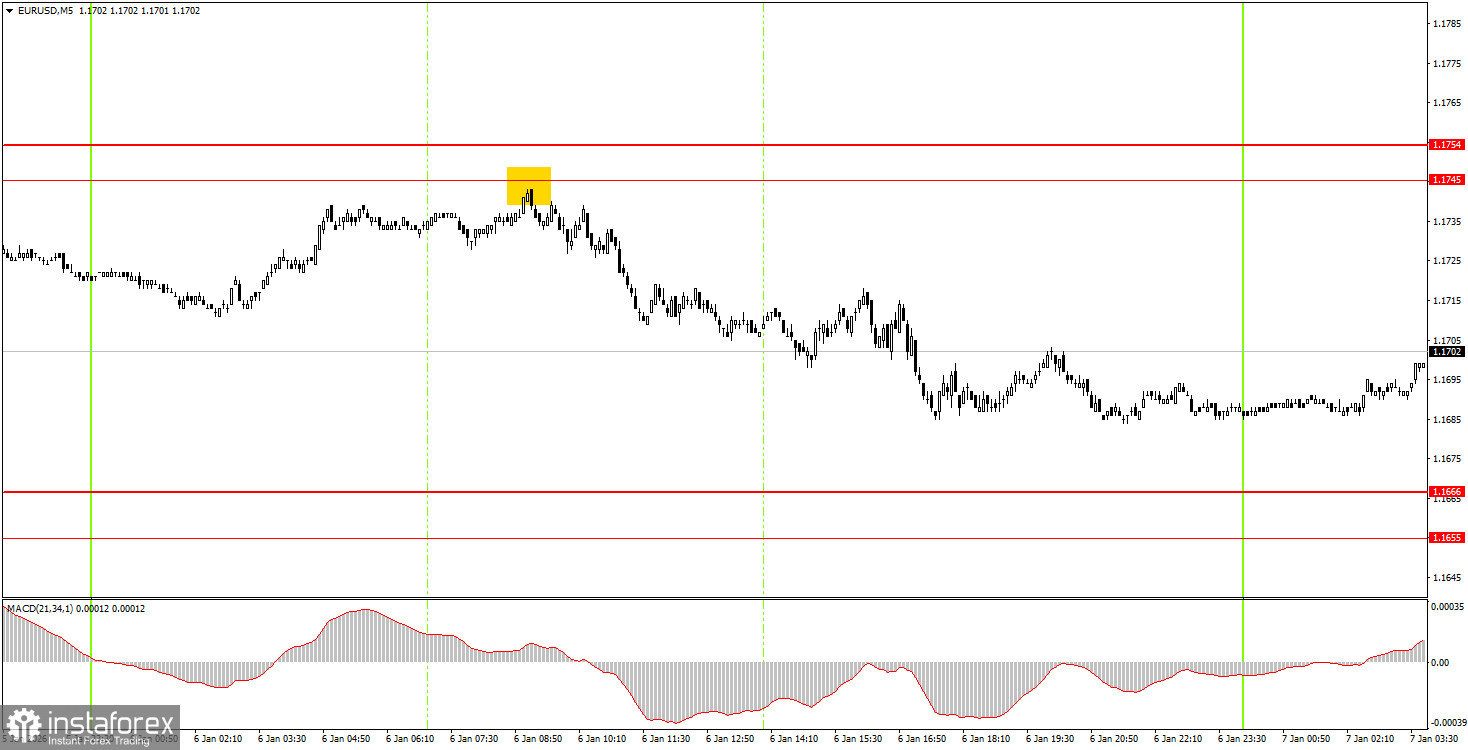
EUR/USD 5M Chart
On the 5-minute timeframe, only one trading signal was formed on Tuesday. At the beginning of the European trading session, the price rebounded from the 1.1745–1.1755 level, which led to a 50-point decline during the day. Thus, even if beginner traders did not wait for the target area to be fully reached, they could still make a good profit by closing the trade manually on Tuesday evening.
How to Trade on Wednesday:
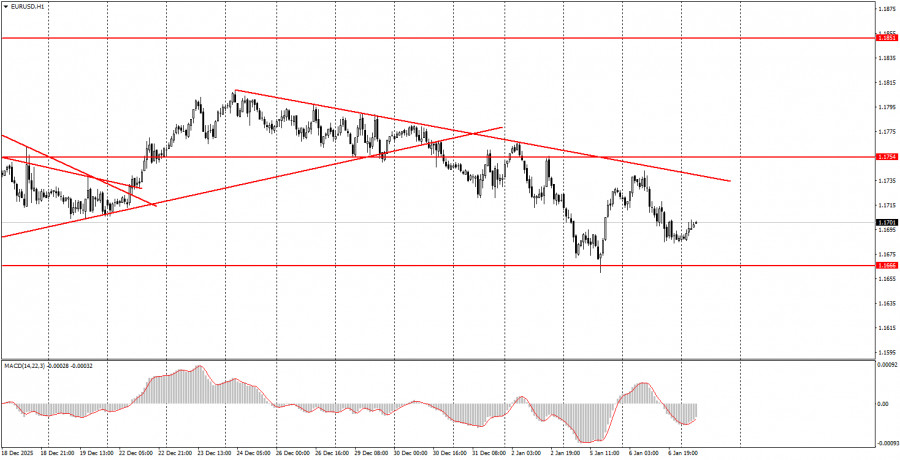
On the hourly timeframe, the trend has nevertheless changed to bearish, but likely not for long. The pair failed to overcome the 1.1800–1.1830 level, which is the upper boundary of the flat on the daily timeframe, so technically the decline is logical and may continue all the way to the 1.1400 level. The overall fundamental and macroeconomic background remains very weak for the U.S. dollar; therefore, we expect the pair's growth to resume in the medium term.
On Wednesday, beginner traders may trade from the 1.1655–1.1666 level. A rebound from this area will allow opening long positions with a target of 1.1745–1.1754. A consolidation below this area will make short positions relevant with a target of 1.1584–1.1591.
On the 5-minute timeframe, the following levels should be considered: 1.1354–1.1363, 1.1413, 1.1455–1.1474, 1.1527–1.1531, 1.1550, 1.1584–1.1591, 1.1655–1.1666, 1.1745–1.1754, 1.1808, 1.1851, 1.1908, 1.1970–1.1988. On Wednesday, the European Union is scheduled to publish an inflation report, to which the market may react if a resonant figure is released. In the United States, the ADP, JOLTs, and ISM Services PMI reports will be published. These data are also quite important.
Basic Rules of the Trading System:
- The strength of a signal is determined by the time required for the signal to form (a rebound or a breakout of a level). The less time it takes, the stronger the signal.
- If two or more trades were opened near a certain level based on false signals, all subsequent signals from that level should be ignored.
- In a flat market, any pair may generate many false signals or none at all. In any case, at the first signs of a flat, it is better to stop trading.
- Trades are opened during the time period from the start of the European session until the middle of the U.S. session, after which all positions should be closed manually.
- On the hourly timeframe, trades based on MACD signals should preferably be taken only when there is good volatility and a trend confirmed by a trend line or a trend channel.
- If two levels are located too close to each other (from 5 to 20 pips), they should be considered as a support or resistance zone.
- After the price moves 15 pips in the correct direction, the Stop Loss should be moved to breakeven.
What's on the Charts:
- Support and resistance price levels are levels that serve as targets when opening buy or sell positions. Take Profit levels can be placed near them.
- Red lines are channels or trend lines that show the current trend and indicate the preferred trading direction.
- The MACD indicator (14, 22, 3)—histogram and signal line—is an auxiliary indicator that can also be used as a source of signals.
Important speeches and reports (always listed in the news calendar) can have a very strong impact on currency pair movements. Therefore, during their release, trading should be conducted with maximum caution or traders should exit the market to avoid a sharp price reversal against the preceding move.
Beginner forex traders should remember that not every trade can be profitable. Developing a clear strategy and proper money management are the keys to success in trading over the long term.