empty
 
 
25.11.2022 12:04 PM
Technical analysis of GBP/USD for November 25, 2022

This image is no longer relevant

Overview :

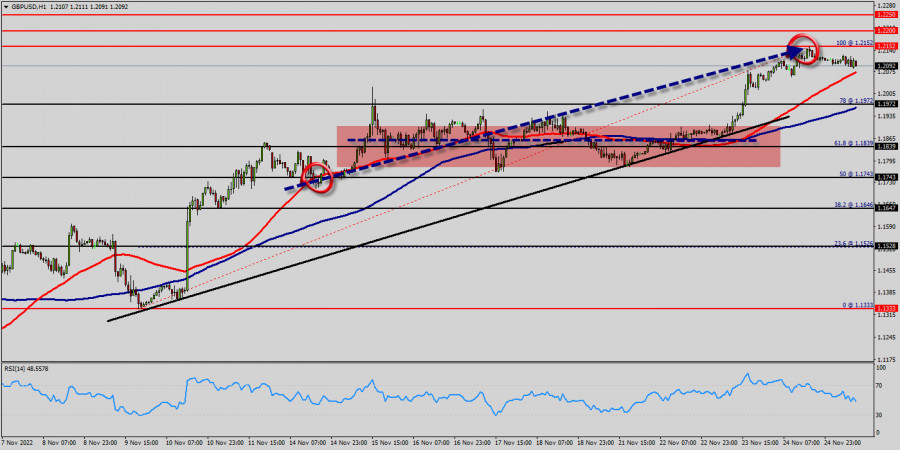
The bullish trend is currently very strong for the GBP/USD pair. As long as the price remains above the support at 1.1972, you could try to take advantage of the bullish rally in short term. The first bullish objective is located at 1.2152 (this price is coincided with the ratio 100% of Fibonacci retracement levels). The bullish momentum would be revived by a break in this resistance. For three weeks GBP/USD increased within an up channel, for that the GBP/USD pair hits new highs 1.2000 and 1.2100.

The GBP/USD price had a significant breakout above the price of 1.1972 and 1.2000. GBP/USD is part of a very strong bullish trend.

Traders may consider trading only long positions as long as the price remains well above the levels of 1.1972 and 1.2000.

Currently, the price is in a bullish channel. This is confirmed by the RSI indicator signaling that we are still in a bullish trending market. As the price is still above the moving average (100), immediate support is seen at 1.1972, which coincides with a golden ratio (78% of Fibonacci).

Consequently, the first support is set at the level of 1.1972. Hence, the market is likely to show signs of a bullish trend around the spot of 1.1972 and 1.2000.

The next resistance located at 1.2152 is the next bullish target to be reached. A bullish break in this resistance would boost the bullish momentum.

The bullish movement could then continue towards the next resistance located at 1.2152. Closing above the pivot point (1.1972) could assure that GBP/USD will move higher towards cooling new highs.

The bulls must break through 1.2100 USD in order to resume the up trend. Buyers would then use the next resistance located at 1.2152 as an objective (this price is coincided with the ratio 100% of Fibonacci retracement levels - the double top - te last bullish wave on the hourly chart).

The GBP/USD price is bullish but climbing higher will be strict, our next target 1.2200. Crossing it would then enable buyers to target 1.2200.

Be careful, given the powerful bullish rally underway, excesses could lead to a short-term rebound. Also it should be noted that Pound unite as the bears lose their momentum. The market is indicating a bullish opportunity above the above-mentioned support levels, for that the bullish outlook remains the same as long as the 100 EMA is headed to the upside. The price has been consolidating between the 1.1978 and 1.2200 over the last few weeks, following a massive rising from the 1.2200 mark. So far, the price has been supported by the 1.1978 and 1.2200 range.

EURUSD
Euro vs US Dollar
Select timeframe
5
min
15
min
30
min
1
hour
4
hours
1
day
1
week
Start trade
Start trade
  • Grand Choice
    Contest by
    InstaForex
    InstaForex always strives to help you
    fulfill your biggest dreams.
    JOIN CONTEST
  • Chancy Deposit
    Deposit your account with $3,000 and get $8000 more!
    In March we raffle $8000 within the Chancy Deposit campaign!
    Get a chance to win by depositing $3,000 to a trading account. Having fulfilled this condition, you become a campaign participant.
    JOIN CONTEST
  • Trade Wise, Win Device
    Top up your account with at least $500, sign up for the contest, and get a chance to win mobile devices.
    JOIN CONTEST
  • 100% Bonus
    Your unique opportunity to get a 100% bonus on your deposit
    GET BONUS
  • 55% Bonus
    Apply for a 55% bonus on your every deposit
    GET BONUS
  • 30% Bonus
    Receive a 30% bonus every time you top up your account
    GET BONUS

Recommended Stories

XAU/USD sta sviluppando uno slancio ribassista. Previsione per il 27 marzo 2023

La coppia XAU/USD sta attualmente sviluppando uno slancio ribassista. Il prezzo dovrebbe scendere verso il 1° livello di supporto a 1.948. Se la coppia continua a scendere, potrebbe testare

Dean Leo 09:48 2023-03-27 UTC+2

BTC/USD: dovrebbe scendere al livello di supporto. Previsione per il 27 marzo 2023

Secondo il grafico giornaliero, la coppia BTC/USD è in ribasso. È previsto un calo al 1° livello di supporto. In generale, lo slancio del bitcoin rispetto al dollaro

Dean Leo 09:45 2023-03-27 UTC+2

BTC/USD, D1: possibile inversione ribassista. Previsione per il 14 marzo 2023

Attualmente, la coppia BTC/USD sta testando il livello di resistenza principale a 1,674, che è il massimo oscillante. Un'inversione da qui potrebbe spingere le quotazioni verso 1,357

Dean Leo 09:01 2023-03-14 UTC+2

USD/CHF, D1: atteso rimbalzo rialzista. Previsione per il 14 marzo 2023

Attualmente la coppia USD/CHF sta testando il livello di supporto principale di 0,9083 corrispondente al livello swing low. Un rimbalzo da qui potrebbe portare ad un aumento delle quotazioni fino

Dean Leo 09:01 2023-03-14 UTC+2

EUR/JPY, H4 | È prevista l'inversione di prezzo dal livello di resistenza principale

Il prezzo si sta spostando verso la resistenza di 1,4639, che è anche un massimo locale. L'inversione da questo segno potrebbe portare a un calo del prezzo al livello

Dean Leo 07:26 2023-03-10 UTC+2

EUR/CHF, H4 | Rottura ribassista possibile

Il prezzo ha sfondato il livello di supporto chiave di 0,9917, che ora si è trasformato in resistenza, provocando una caduta al livello di take-profit target di 0,9851

Dean Leo 07:26 2023-03-10 UTC+2

EUR/USD e GBP/USD 9 marzo: analisi tecnica della situazione

Il giorno prima c'è stato un altro cambiamento nelle priorità giornaliere, a causa del quale la coppia si è trovata sotto il supporto mensile (1,0579), nella zona ribassista relativa alla

Evangelos Poulakis 09:57 2023-03-09 UTC+2

Analisi tecnica settimanale: coppia di valute EUR/USD dal 6 all'11 marzo

La scorsa settimana, la coppia, salendo, ha testato 21 linee medie semplici a 1,0688 (linea tratteggiata nera) ed è scesa, chiudendo la candela settimanale a 1,0634. Lavoro al rialzo possibile

Stefan Doll 09:25 2023-03-06 UTC+2

Analisi tecnica settimanale: coppia di valute GBP/USD dal 6 all'11 febbraio

La scorsa settimana la coppia, salendo, ha testato il livello di ritracciamento del 14,6%, 1,2142 (linea tratteggiata gialla), ed è scesa, chiudendo la candela settimanale a 1,2040. Questa settimana

Stefan Doll 09:25 2023-03-06 UTC+2

EURUSD costruisce il supporto

Scala EURUSD H4 L'euro, a quanto pare, ha esaurito il suo potenziale di caduta. La scorsa settimana, alla notizia di un'inflazione superiore alle attese negli Stati Uniti, l'euro non solo

Jozef Kovach 08:38 2023-03-01 UTC+2
In questo momento non potete parlare al telefono?
Ponete la vostra domanda nella chat.