empty
 
 
05.12.2022 06:15 AM
Trading Signal for Gold (XAU/USD) on December 05-06, 2022: sell in case of pullback at 1,807-1,812 (+2/8 Murray - overbought)

This image is no longer relevant

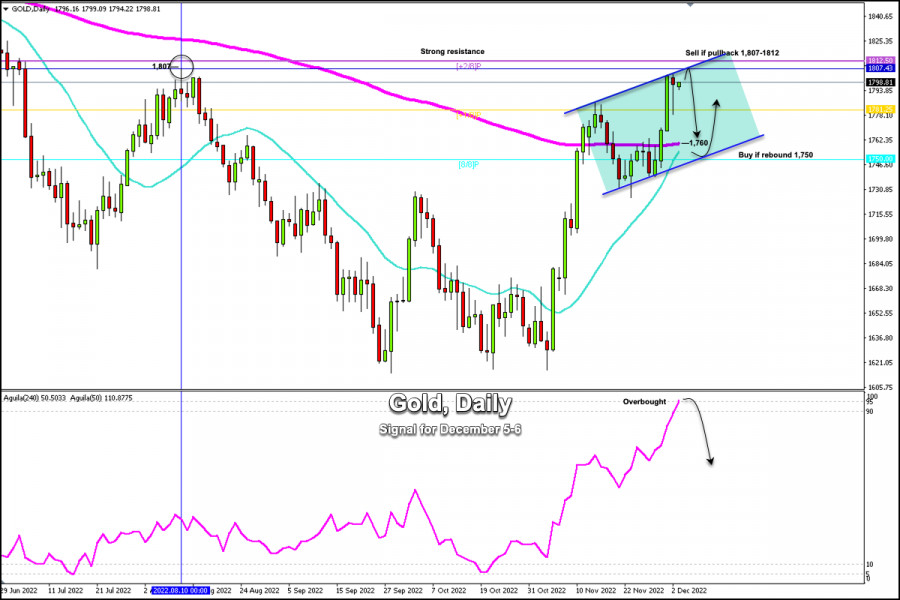
Early in the European session, Gold (XAU/USD) is trading around 1,798.81 with a bullish bias and it is likely that it could reach the August 10 high at about 1,807.

Last week's US Non-Farm Payrolls (NFP) report showed that the economy added 263,000 new jobs in November, above the consensus of 200,000.

At the moment of knowing this data, the market reacted in favor of the dollar, which caused a fall in gold towards the area of 1,780. The market expects the Fed to soften its monetary policy in the short term. Thus, the market reacted against it and stopped taking refuge in the dollar, which benefited gold.

Gold is likely to face a strong barrier this week, as it has strong resistance between the area of 1,807-1,812.

According to the daily chart, we can see that gold is reaching extremely overbought levels, so we expect gold to have a strong rejection around the area of 1,807 - 1,812. The last barrier around 1,812 is located +2/8 Murray and acts as strong resistance and also represents the high for the month of June.

In case gold falls below 1,812-1,807, we could have an opportunity to sell, with targets at 1,781 (+1/8 Murray) and the 200 EMA located at 1,760 (200 EMA).

On the daily chart, we can see that gold has been trading within an uptrend channel since November 19. The metal is likely to find resistance around 1,810 and the price could fall towards the support zone of 1,750. In case this scenario occurs, gold could find a technical bounce around the 8/8 Murray and then resume its bullish bias.

Our trading plan for the next few hours is to wait for gold to reach resistance levels around 1,807-1,812 and wait for a consolidation to occur below this level to sell, with targets at 1,781 and 1,760. The eagle indicator is showing an extremely overbought signal which supports our bearish strategy.

EURUSD
Euro vs US Dollar
Select timeframe
5
min
15
min
30
min
1
hour
4
hours
1
day
1
week
Start trade
Start trade
  • Grand Choice
    Contest by
    InstaForex
    InstaForex always strives to help you
    fulfill your biggest dreams.
    JOIN CONTEST
  • Chancy Deposit
    Deposit your account with $3,000 and get $8000 more!
    In March we raffle $8000 within the Chancy Deposit campaign!
    Get a chance to win by depositing $3,000 to a trading account. Having fulfilled this condition, you become a campaign participant.
    JOIN CONTEST
  • Trade Wise, Win Device
    Top up your account with at least $500, sign up for the contest, and get a chance to win mobile devices.
    JOIN CONTEST
  • 100% Bonus
    Your unique opportunity to get a 100% bonus on your deposit
    GET BONUS
  • 55% Bonus
    Apply for a 55% bonus on your every deposit
    GET BONUS
  • 30% Bonus
    Receive a 30% bonus every time you top up your account
    GET BONUS

Recommended Stories

BTC/USD, D1: possibile inversione ribassista. Previsione per il 14 marzo 2023

Attualmente, la coppia BTC/USD sta testando il livello di resistenza principale a 1,674, che è il massimo oscillante. Un'inversione da qui potrebbe spingere le quotazioni verso 1,357

Dean Leo 09:01 2023-03-14 UTC+2

USD/CHF, D1: atteso rimbalzo rialzista. Previsione per il 14 marzo 2023

Attualmente la coppia USD/CHF sta testando il livello di supporto principale di 0,9083 corrispondente al livello swing low. Un rimbalzo da qui potrebbe portare ad un aumento delle quotazioni fino

Dean Leo 09:01 2023-03-14 UTC+2

EUR/JPY, H4 | È prevista l'inversione di prezzo dal livello di resistenza principale

Il prezzo si sta spostando verso la resistenza di 1,4639, che è anche un massimo locale. L'inversione da questo segno potrebbe portare a un calo del prezzo al livello

Dean Leo 07:26 2023-03-10 UTC+2

EUR/CHF, H4 | Rottura ribassista possibile

Il prezzo ha sfondato il livello di supporto chiave di 0,9917, che ora si è trasformato in resistenza, provocando una caduta al livello di take-profit target di 0,9851

Dean Leo 07:26 2023-03-10 UTC+2

EUR/USD e GBP/USD 9 marzo: analisi tecnica della situazione

Il giorno prima c'è stato un altro cambiamento nelle priorità giornaliere, a causa del quale la coppia si è trovata sotto il supporto mensile (1,0579), nella zona ribassista relativa alla

Evangelos Poulakis 09:57 2023-03-09 UTC+2

Analisi tecnica settimanale: coppia di valute EUR/USD dal 6 all'11 marzo

La scorsa settimana, la coppia, salendo, ha testato 21 linee medie semplici a 1,0688 (linea tratteggiata nera) ed è scesa, chiudendo la candela settimanale a 1,0634. Lavoro al rialzo possibile

Stefan Doll 09:25 2023-03-06 UTC+2

Analisi tecnica settimanale: coppia di valute GBP/USD dal 6 all'11 febbraio

La scorsa settimana la coppia, salendo, ha testato il livello di ritracciamento del 14,6%, 1,2142 (linea tratteggiata gialla), ed è scesa, chiudendo la candela settimanale a 1,2040. Questa settimana

Stefan Doll 09:25 2023-03-06 UTC+2

EURUSD costruisce il supporto

Scala EURUSD H4 L'euro, a quanto pare, ha esaurito il suo potenziale di caduta. La scorsa settimana, alla notizia di un'inflazione superiore alle attese negli Stati Uniti, l'euro non solo

Jozef Kovach 08:38 2023-03-01 UTC+2

EUR/USD e GBP/USD 28 febbraio – analisi tecnica della situazione

Dopo aver aggiornato il minimo della scorsa settimana, i ribassisti hanno ceduto alla nuova attività dell'avversario. Di conseguenza, i tori sono riusciti a organizzare un rialzo produttivo e hanno riportato

Evangelos Poulakis 06:44 2023-02-28 UTC+2

EUR/USD e GBP/USD 23 febbraio – analisi tecnica della situazione

Ieri i venditori hanno aggiornato il minimo della scorsa settimana (1,0613) e chiuso la giornata sotto il supporto mensile (1,0611). Il mantenimento delle posizioni raggiunte aprirà nuovi punti di riferimento

Evangelos Poulakis 06:54 2023-02-23 UTC+2
In questo momento non potete parlare al telefono?
Ponete la vostra domanda nella chat.