EUR/CHF
Brief analysis
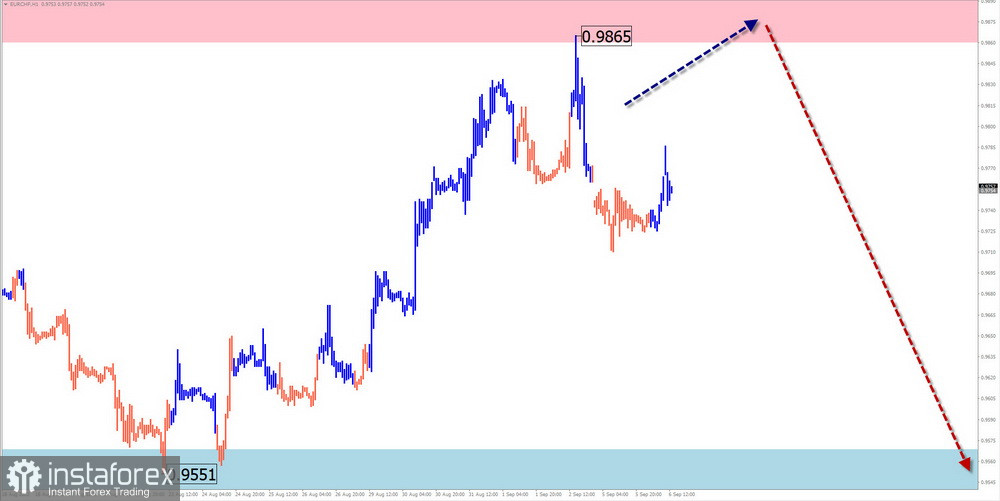
Since more than four years ago, the quotes for the cross rate of the euro versus the Swiss franc have been trending downward. Since February of this year, the unfinished part has started keeping score. A correcting part (B), in the shape of a moving plane, has developed in its structure over the past two months. The wave is almost finished.
Forecast for the coming week:
We can anticipate the upward movement vector to continue in the upcoming days until it reaches its full conclusion in the vicinity of the predicted resistance. After the flat phase, a reversal and a continuation of the price's downward movement are anticipated by the end of the week. The support level displays the pair's most likely lower limit for its weekly path.
Potential zones for reversals
Resistance:
- 0.9860/0.9910
Support:
- 0.9570/0.9520
Recommendations
Purchases have limited potential and are only feasible in tiny quantities during particular sessions.
Sales are not advised until confirmed reversal indications approach the resistance zone.
EUR/GBP
Brief analysis
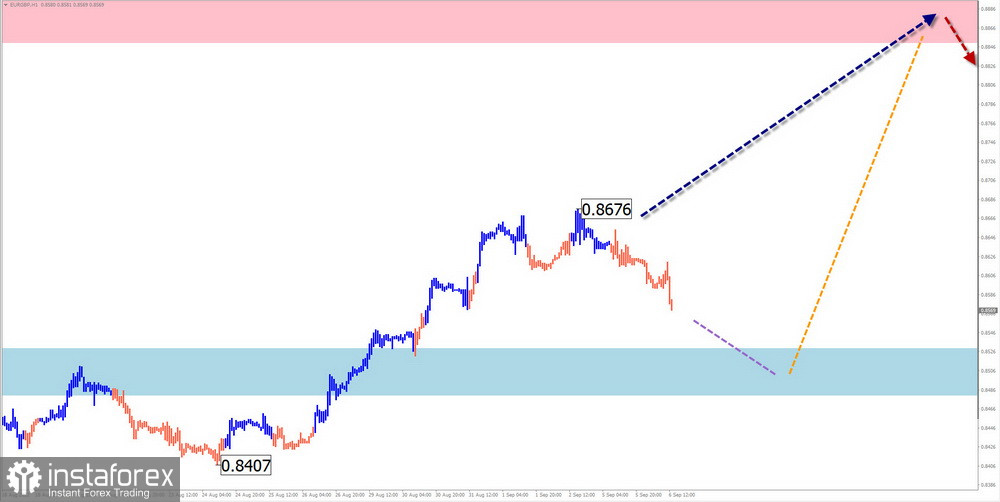
A declining wave has been dictating the movement of the euro cross against the pound since the spring of 2020. The price has been constructing a counter-corrective since March of this year, although it has not yet been finished. The final component of the bullish wave's structure is missing (C).
Forecast for the coming week:
The pair's price is anticipated to move in the lateral plane over the next few days. There is a chance of a downward trend with a drop in resistance levels. A shift in direction and the continuation of the upward movement vector are anticipated closer to the weekend. The resistance zone displays the upper boundary of the anticipated price range.
Potential zones for reversals
Resistance:
- 0.8850/0.8900
Support:
- 0.8530/0.8480
Recommendations
Sales: possibilities are limited and may occur inside the intraday fractional lot.
Purchases: advised following the appearance of signals verified by your car in the support zone.
AUD/JPY
Brief analysis
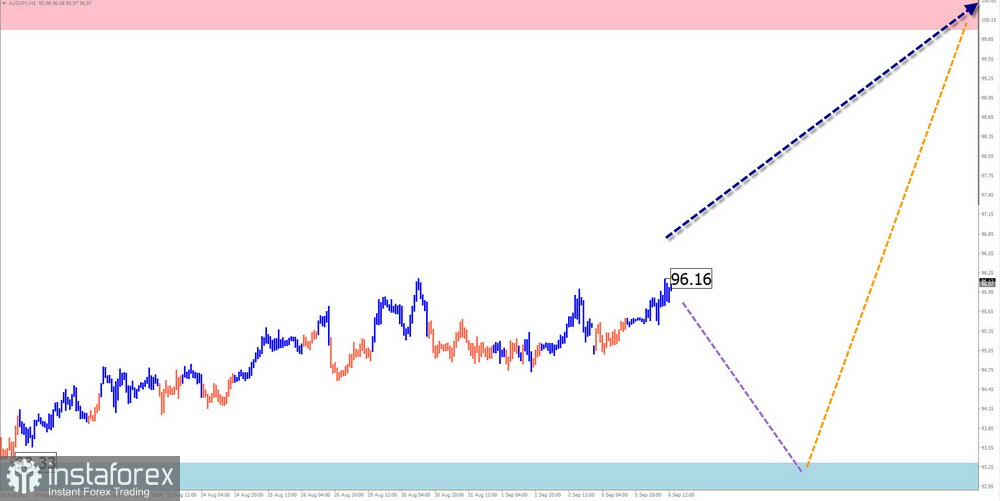
Since mid-May, the unfinished wave building on the Australian dollar and Japanese yen cross-pair chart has been counting down. Since August, the structure has been creating the final portion of the wave. The price growth will resume after the intermediate correction initiated by the broken resistance level.
Forecast for the coming week:
There is a chance of a flat moving mood with a modest lowering of the support zone in the upcoming days. By the week's conclusion, there is a higher likelihood that the bullish path of action would reverse and resume.
Potential zones for reversals
Resistance:
- 100.00/100.50
Support:
- 93.30/92.80
Recommendations
Sales: a decreased lot is available within the parameters of specific trading sessions.
Before the signals confirmed by your vehicle appear in the support section, purchases are not advised.
#Ethereum
Brief analysis
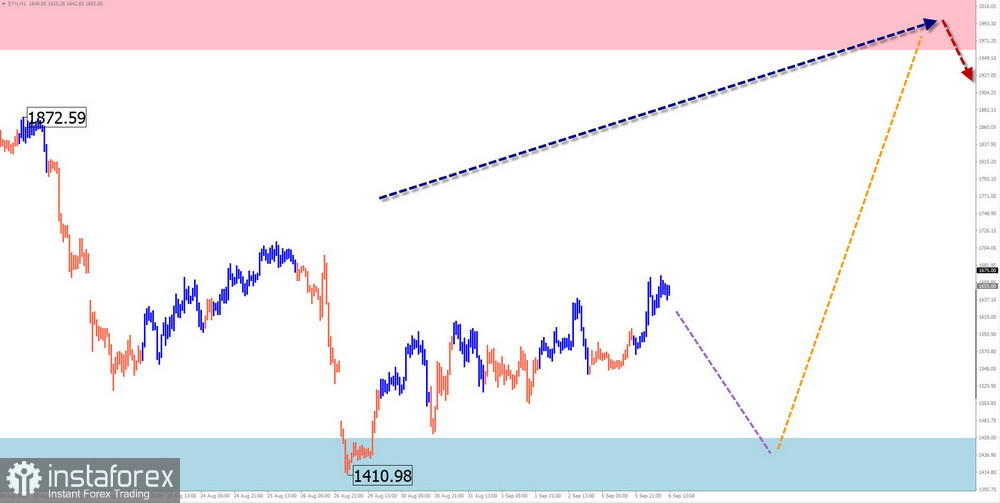
Since November last year, Ethereum quotes have been heading toward the "south" of the pricing field. A temporary price increase has taken the place of the drop during the past three months. The lateral plane is where the wave grows the most. The structure's incompleteness is evident from the analysis. It is missing the last end (C). The lower edge of the horizontal price channel is where the quotes for the pair are located.
Forecast for the coming week:
Price movement along the support boundaries is anticipated over the next few days. The week's second half can be more unpredictable. You can anticipate a shift in strategy and a restart of the price rise.
Potential zones for reversals
Resistance:
- 1960.0/2060.0
Support:
- 1460.0/1360.0
Recommendations
Sales: pose a high level of risk and may result in deposit losses.
Purchases are advised if confirmed trade entry signals appear in the vicinity of the support zone.
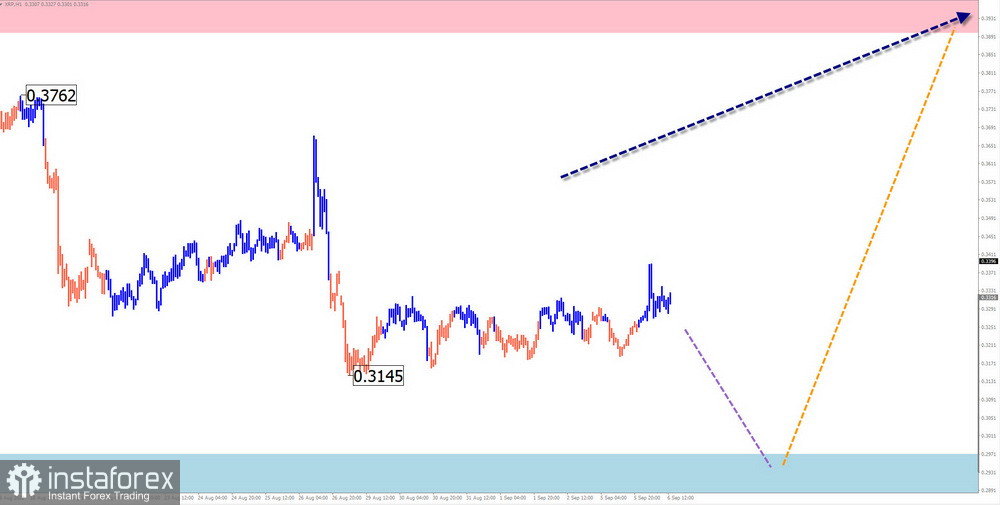
#Ripple
Brief analysis
Demand surged dramatically in December of last year, which caused Ripple's quotes to decline. Currently, 99.8% of the high price has been lost. The currency can be used for transactions as a commodity because there is a demand for it. The incomplete portion began in the middle of June and is a component of the overall trend. This is a horizontal plane-shaped upward correction wave. The last piece of the construction is missing (C).
For the coming week:
You can anticipate a decrease in the price of altcoins over the next several days, up to the support level. The likelihood of activation, reversal, and resumed price growth increases after the week. The resistance zone shows the goal zone of the impending climb.
Potential zones for reversals
Resistance:
- 0.3900/0.4000
Support:
- 0.2970/0.2870
Recommendations
Sales: have a tiny potential and can succeed in one-on-one meetings with a small number.
Purchases: after purchase signals appear in the support area, which is supported by the vehicles you use, they start to look good.
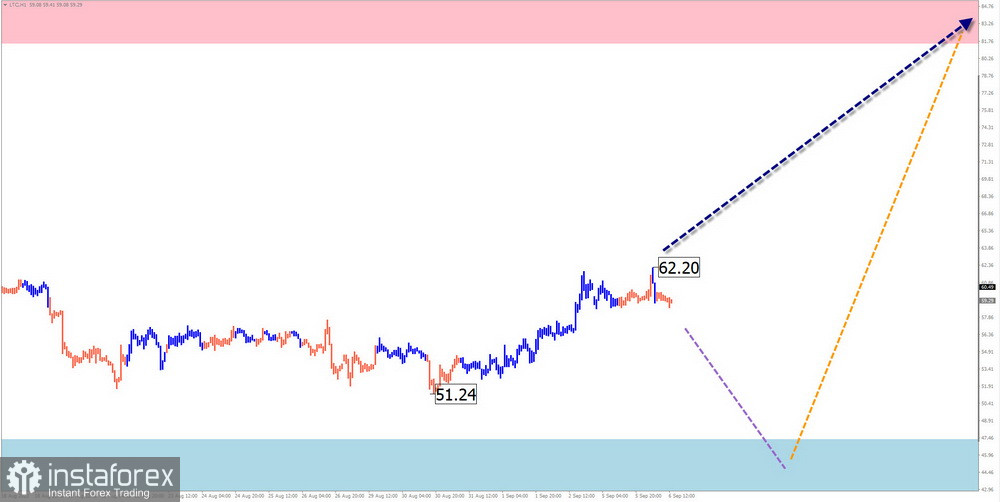
#Litecoin
Brief analysis
Demand for Litecoin quotes peaked before that of other cryptocurrencies. A sinking wave began at the start of May last year. After
Since November, the subsequent decline stage, which has not yet been finished, has been turning into a short-term corrective recovery. The coin price has been lateralized since the start of the summer. The structure of the corrections does not indicate completeness.
Forecast for the coming week:
The most likely scenario for the upcoming days is that the horizontal price corridor will remain flat. The likelihood of more volatility, a shift in trend, and a restart of price recovery increase at the end of the week.
Potential zones for reversals
Resistance:
- 81.50/86.50
Support:
- 47.30/42.30
Recommendations
Sales are feasible in the context of private sessions with a smaller lot.
Purchases are not advised until reversal signs that your trading systems have verified show up around the support zone.
Reasons: In the simple wave analysis (UVA), each wave has three components (A-B-C). The final, incomplete wave is examined at each TF. The dotted line depicts the predicted movements.
The wave algorithm does not account for the instruments' temporal movement length.