Analyzing Tuesday's trades:
EUR/USD on 30M chart
EUR/USD continued to decline on Tuesday. I already warned you the momentum movement will continue for a few more days. This is what we saw on Monday and Tuesday. There was absolutely no macroeconomic data on Tuesday. The only fundamental event was Federal Reserve Chairman Jerome Powell's speech. So, there were no serious reasons for the pair to fall. But there are some good reasons. We have repeatedly mentioned that the euro was overbought and it needs a bearish correction. It has been falling for four days now and has lost 350 points in that time. Not much for the euro. But what can you do if all it has been doing for several months was to rise. Now there is a "debt to pay". Powell delivers a speech in Washington, but beginners should have been out of the market by now. Nevertheless, Powell's speech can provoke a reaction from the market, but it is hard to say what kind of reaction it's going to be if the dollar has been rising all day long. Powell's rhetoric is likely to remain hawkish, but will the dollar have the strength to rise again?
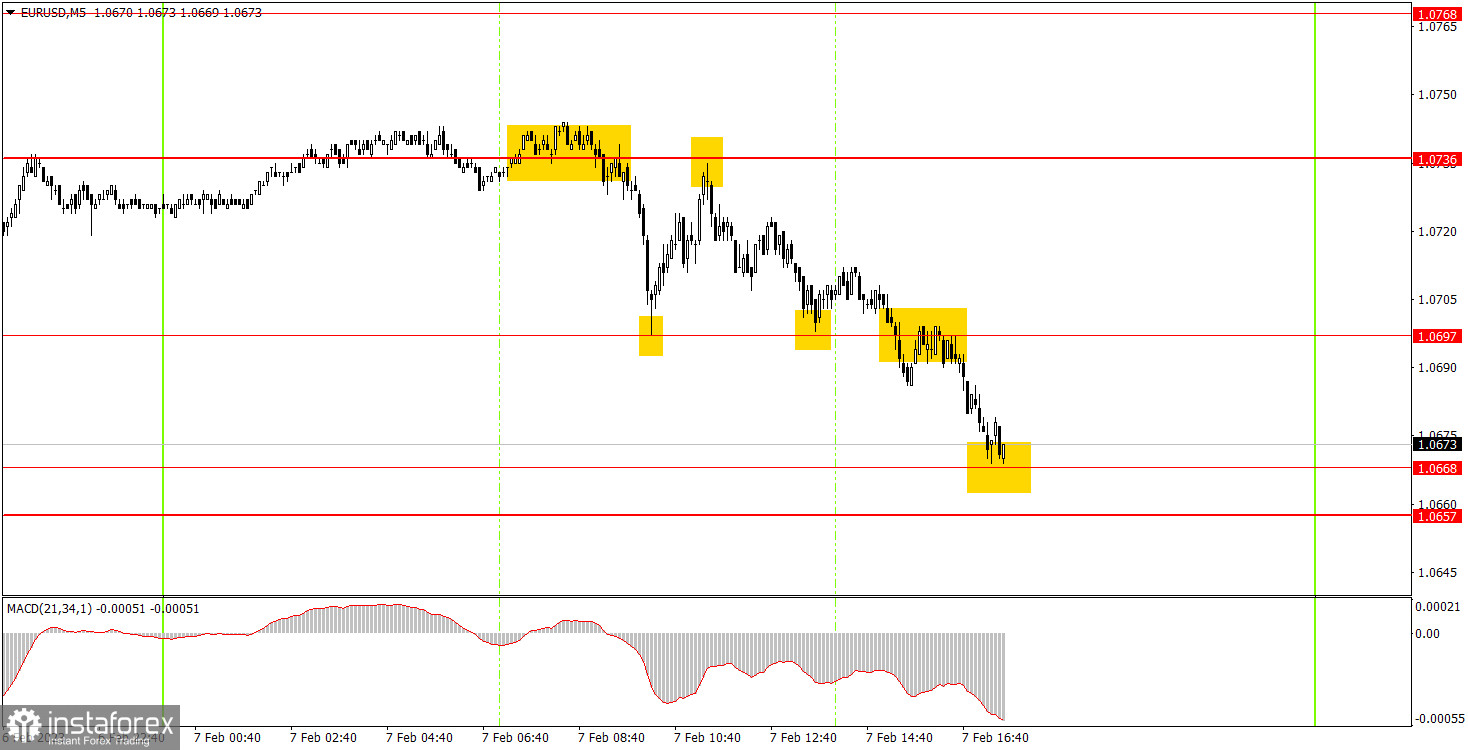
EUR/USD on M5 chart
There were a whole bunch of trading signals on the 5-minute chart. At the very beginning of the European session, the pair rebounded from 1.0736 (not too accurate), and then went down to 1.0697. You could earn about 20 pips on the short position. This was followed by a reverse growth to 1.0736 and another rebound from it. Another 20 points of profit. Then it fell to 1.0697 and there goes another rebound, which means another 20 points of profit. The last rebound from 1.0697 was false since the pair continued to fall. The deal closed with a loss of about 20 pips. Traders could open a new short position since the pair settled below 1.0697. An hour later, it reached the nearest target level of 1.0668, where the position should have been closed, the profit was about 12 pips. The rebound from this level could not be priced, but even this buy signal turned out to be profitable. In the worst case scenario, beginners could earn 50 points of profit.
Trading tips on Wednesday:
On the 30-minute chart, the pair continues to fall and it is not going to stop there. I expect an even sharper fall from the euro since it has been rising for a long time for no reason. There is no trend line or channel yet, we need a bullish correction to form a second pivot point. On the 5-minute chart, it is recommended to trade at the levels 1.0535, 1.0587-1.0607, 1.0657-1.0668, 1.0697, 1.0736, 1.0768, 1.0806, 1.0857-1.0867. As soon as the price passes 15 pips in the right direction, you should set a Stop Loss to breakeven. On Wednesday, no interesting events are scheduled in the EU, and the calendar of events is also empty in the US. Therefore, volatility might be low on Wednesday and it is high time for the pair to enter a bit of a bullish correction.
Basic rules of the trading system:
1) The strength of the signal is determined by the time it took the signal to form (a rebound or a breakout of the level). The quicker it is formed, the stronger the signal is.
2) If two or more positions were opened near a certain level based on a false signal (which did not trigger a Take Profit or test the nearest target level), then all subsequent signals at this level should be ignored.
3) When trading flat, a pair can form multiple false signals or not form them at all. In any case, it is better to stop trading at the first sign of a flat movement.
4) Trades should be opened in the period between the start of the European session and the middle of the US trading hours when all positions must be closed manually.
5) You can trade using signals from the MACD indicator on the 30-minute time frame only amid strong volatility and a clear trend that should be confirmed by a trendline or a trend channel.
6) If two levels are located too close to each other (from 5 to 15 pips), they should be considered support and resistance levels.
On the chart:
Support and Resistance levels are the levels that serve as targets when buying or selling the pair. You can place Take Profit near these levels.
Red lines are channels or trend lines that display the current trend and show in which direction it is better to trade now.
The MACD indicator (14, 22, and 3) consists of a histogram and a signal line. When they cross, this is a signal to enter the market. It is recommended to use this indicator in combination with trend patterns (channels and trendlines).
Important announcements and economic reports that can be found on the economic calendar can seriously influence the trajectory of a currency pair. Therefore, at the time of their release, we recommend trading as carefully as possible or exiting the market in order to avoid sharp price fluctuations.
Beginners on Forex should remember that not every single trade has to be profitable. The development of a clear strategy and money management is the key to success in trading over a long period of time.