Analyzing Friday's trades:
EUR/USD on 30M chart
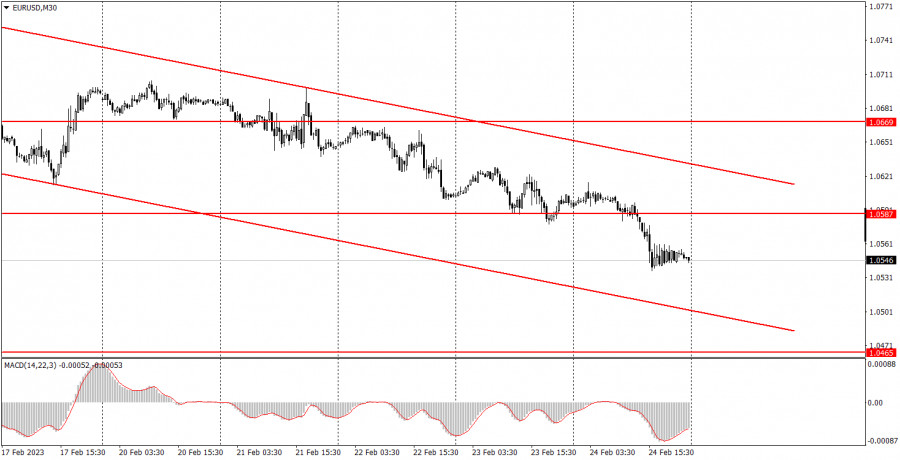
EUR/USD continued to fall on Friday and easily overcame 1.0587. The descending channel continues to indicate a downtrend and now traders have no reason to buy the pair. On Friday, there were no particularly important fundamental and macroeconomic events. Especially, the events that could provoke a sharp strengthening of the US dollar. The University of Michigan Consumer Sentiment Index turned out to be better than expected, as well as the Personal Income and Consumer Spending data. However, these reports are not so important that the dollar's fate depends on them. Moreover, the pair started to fall even before the reports were released. Thus, we conclude that everything goes according to the plan, the technical plan. I have repeatedly mentioned that the euro rose too much, too sharply and too unreasonably during the last half year. Therefore, a tangible bearish correction had to start. And that is exactly what we are seeing for several weeks now. And it looks like it hasn't ended.
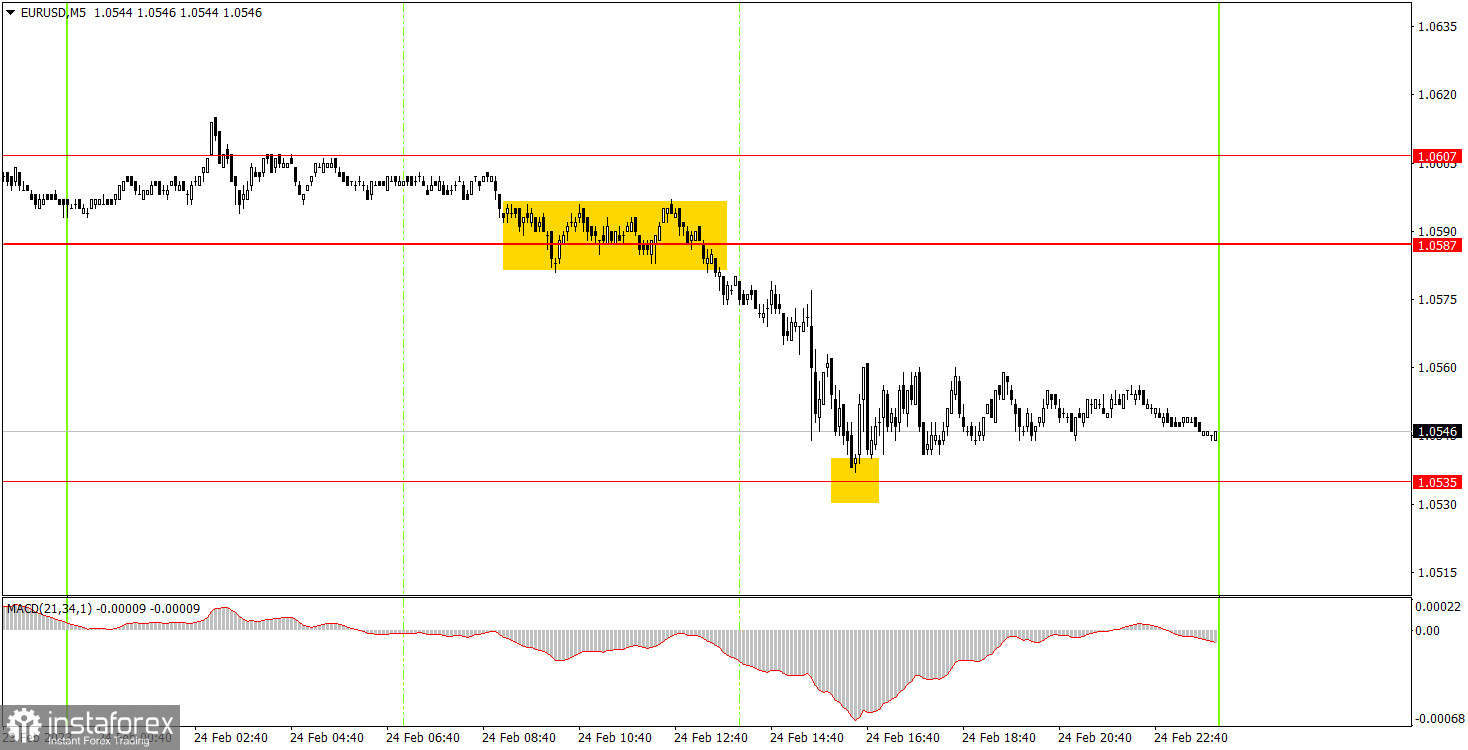
EUR/USD on 5M chart
There is not much to say about Friday's trading signals since there were only two of them. First, the pair overcame 1.0587, which was a sell signal. Then it bounced from 1.0535 with a small margin of error. In the first case, beginners could open a short position, with the profit of not less than 30 pips. The second signal was followed by a long position, and you could also earn 10-20 pips, after closing it manually closer to the evening. Thus, taking into account the total volatility of the day, equal to 66 points, 40-50 points of profit is very good.
Trading tips on Monday:
On the 30-minute chart, the pair as a whole maintains the downtrend. The movement is quite weak but still stable. Volatility remains low and there are very few news and reports lately. Some days are quite good and some can be difficult for trading. On the 5-minute chart, it is recommended to trade at the levels 1.0391, 1.0433, 1.0465-1.0483, 1.0535, 1.0587-1.0607, 1.0669, 1.0697, 1.0792. As soon as the price passes 15 pips in the right direction, you should set a Stop Loss to breakeven. On Monday, the US Durable Goods Orders report will be released. This report used to have a very strong influence on the pair's movement, but lately it is no more important than the Business Activity Index or the Consumer Sentiment Index. I don't expect the market to react to this report unless the results considerably differ from the forecast. And on Monday, because of the special status of the day, the movements might be quite weak.
Basic rules of the trading system:
1) The strength of the signal is determined by the time it took the signal to form (a rebound or a breakout of the level). The quicker it is formed, the stronger the signal is.
2) If two or more positions were opened near a certain level based on a false signal (which did not trigger a Take Profit or test the nearest target level), then all subsequent signals at this level should be ignored.
3) When trading flat, a pair can form multiple false signals or not form them at all. In any case, it is better to stop trading at the first sign of a flat movement.
4) Trades should be opened in the period between the start of the European session and the middle of the US trading hours when all positions must be closed manually.
5) You can trade using signals from the MACD indicator on the 30-minute time frame only amid strong volatility and a clear trend that should be confirmed by a trendline or a trend channel.
6) If two levels are located too close to each other (from 5 to 15 pips), they should be considered support and resistance levels.
On the chart:
Support and Resistance levels are the levels that serve as targets when buying or selling the pair. You can place Take Profit near these levels.
Red lines are channels or trend lines that display the current trend and show in which direction it is better to trade now.
The MACD indicator (14, 22, and 3) consists of a histogram and a signal line. When they cross, this is a signal to enter the market. It is recommended to use this indicator in combination with trend patterns (channels and trendlines).
Important announcements and economic reports that can be found on the economic calendar can seriously influence the trajectory of a currency pair. Therefore, at the time of their release, we recommend trading as carefully as possible or exiting the market in order to avoid sharp price fluctuations.
Beginners on Forex should remember that not every single trade has to be profitable. The development of a clear strategy and money management is the key to success in trading over a long period of time.