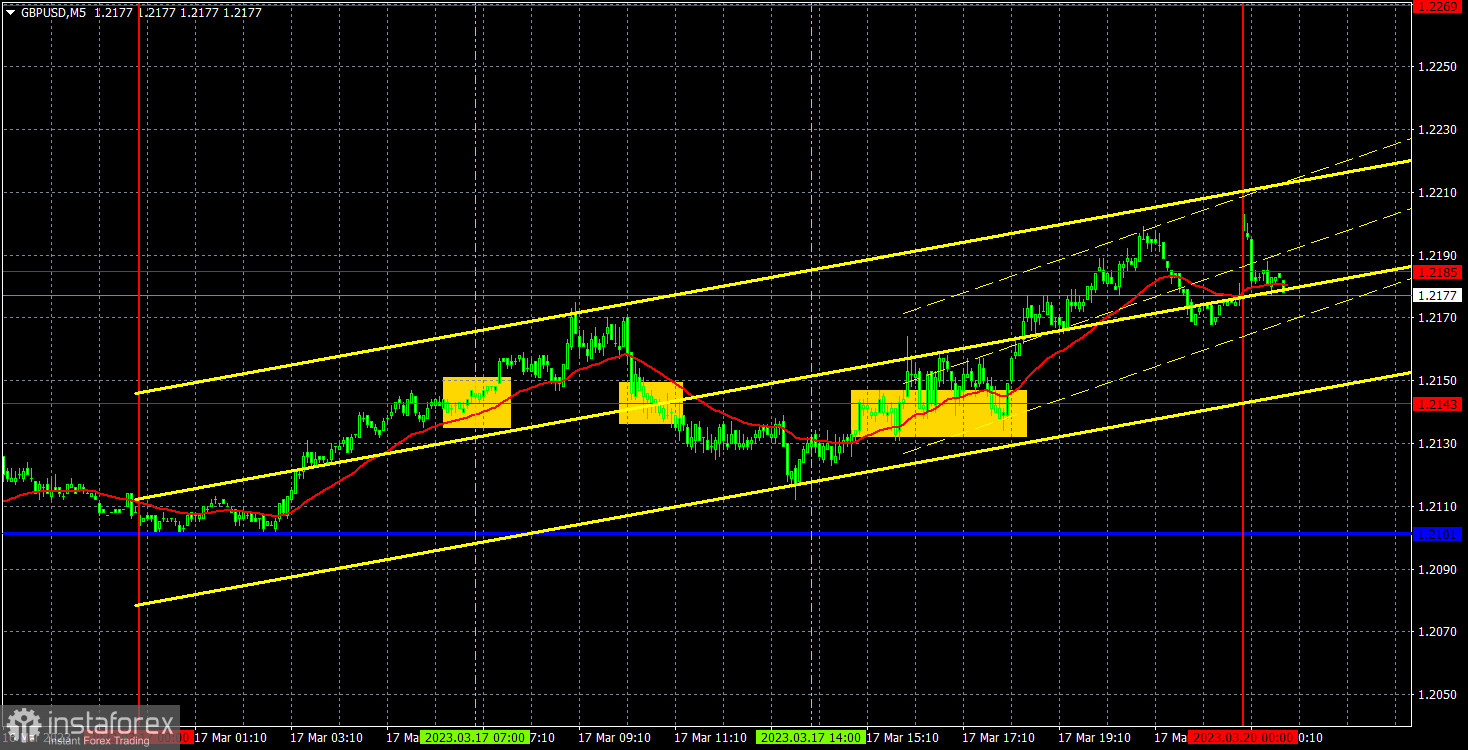
5M chart of GBP/USD
GBP/USD traded almost identical to EUR/USD on Friday. In the morning, the pound was also falling, although the report on European inflation had nothing to do with it. That's why I think that both pairs moved without any relation to the macroeconomic background. The market is already in waiting mode for the Federal Reserve and Bank of England meetings, but the pound is approaching them in a good mood, having risen by 400 points within the last week. Recall that this growth by 60-70% was provoked by the rebound on the 24-hour chart from the lower limit of the horizontal channel. That is, from 1.1840. Thus, the pound may continue to rise up to the upper limit, i.e. to 1.2440, irrespective of the "fundamentals". However, we have a good movement on the hourly chart, so it is quite possible to trade on the lower chart.
Three trading signals during the day, and all three were near 1.2143. Traders may have triggered only the first two, as they have not triggered the nearest target level. Accordingly, Stop Loss at breakeven (in each case in the right direction was passed 20 points) was triggered on both. The third signal should not be triggered based on these data.
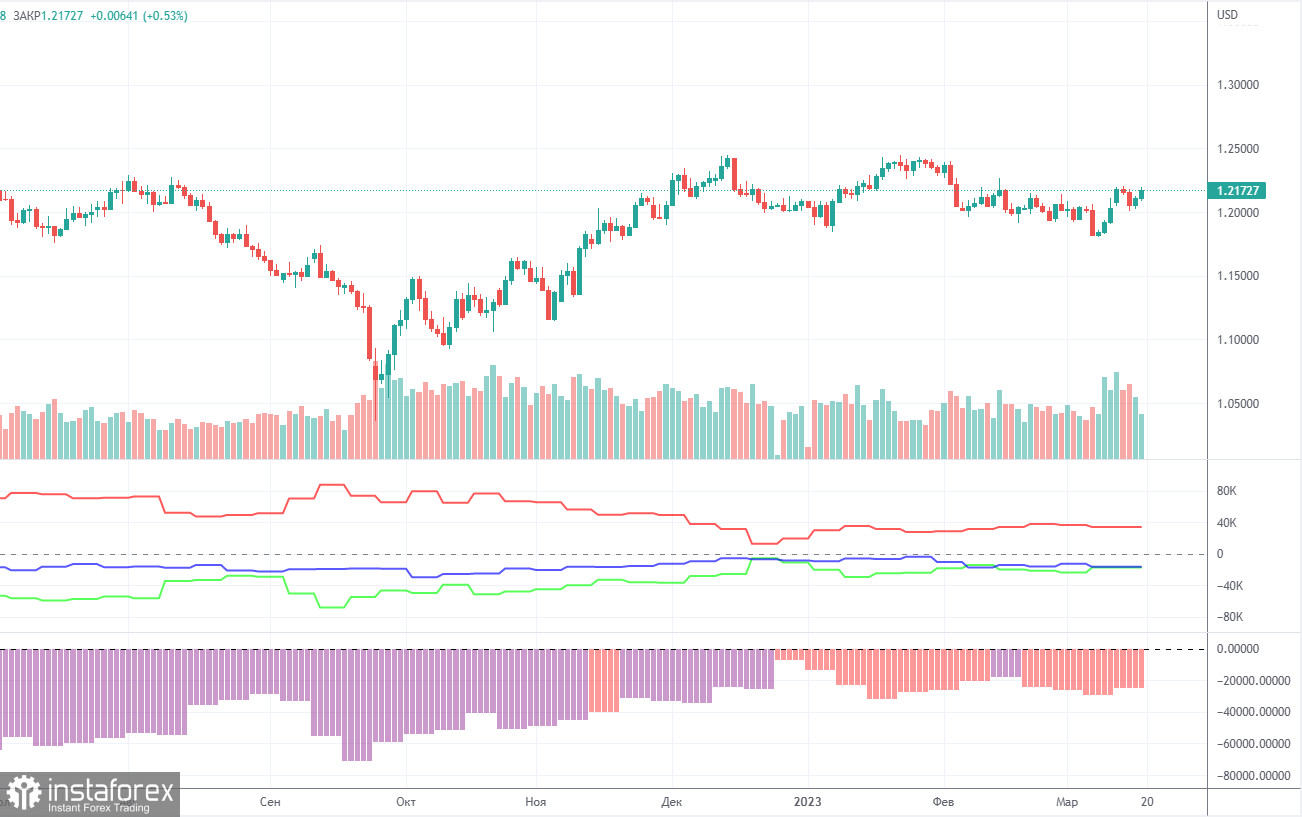
COT report:
For the British pound, the COT reports are still coming out very late, with the CFTC continuing to catch up on the chart. The last report available is for March 7. According to that report, the non-commercial group opened 7,500 long positions and 1,200 short ones. Thus, the net position of non-commercial traders increased by 6,300 and continues to grow. The net position indicator has been steadily growing over the past months but the mood of major traders still remains bearish. Although the pound sterling is growing against the dollar (in the medium term), it is very difficult to answer the question why it is doing this from a fundamental point of view. It is quite possible that the pound sterling may slump in the near future. Formally, it has already begun its downward movement but so far it looks more like a flat. Notably, both major pairs are moving similarly at the moment. However, the net position for the euro is positive and even implies the imminent completion of the upward momentum, whereas for the pound it is negative. But at the same time, the pound has already grown by 2100 points, which is a lot, and without a strong bearish correction the continuation of the growth will be absolutely illogical. The non-commercial group opened a total of 66,000 shorts and 46,000 longs. We remain skeptical about the long-term growth in the British currency and expect it to fall deeper.
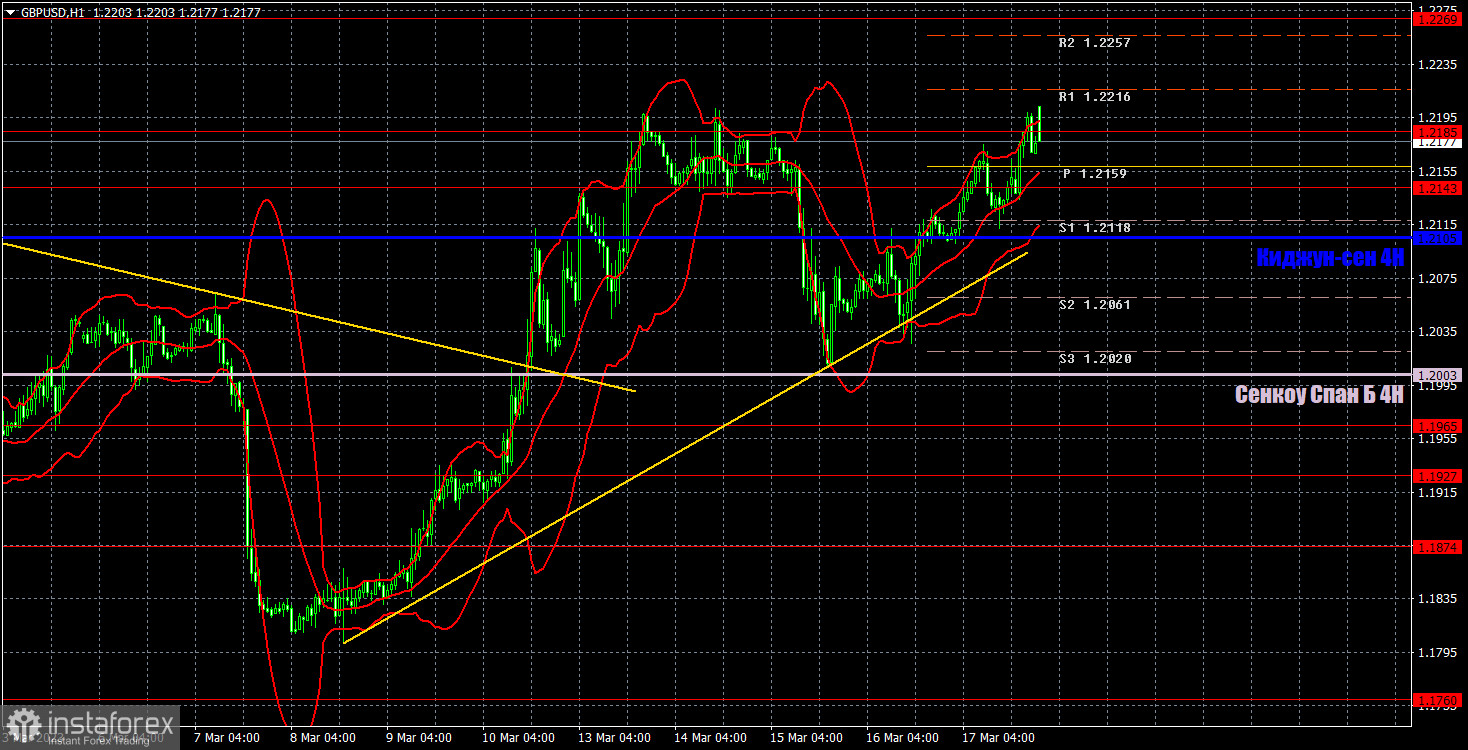
1H chart of GBP/USD
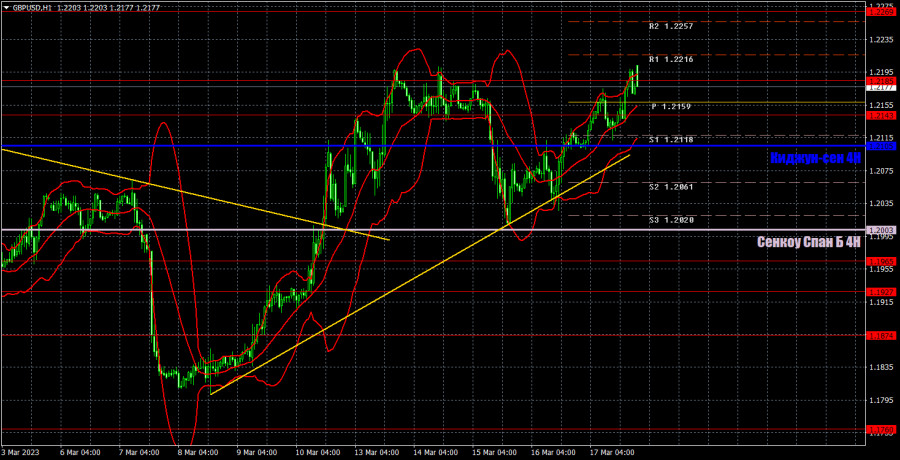
On the one-hour chart, GBP/USD has not yet fallen below the Ichimoku indicator lines, so there is still hope that it can rise further. At least within the horizontal channel on the 24-hour chart, which is 600 points wide. Therefore, the pound still has a potential to rise, but only technically. From a fundamental perspective, we have expected the pound to fall for a long time now, but at the moment, there is a trend line, which supports the growth at least a little bit. But remember that all the trend lines of the last months were short-term, not more than a week. So, it can consolidate below it at any time. On March 20, it is recommended to trade at the key level of 1.1760, 1.1874, 1.1927, 1.1965, 1.2143, 1.2185, 1.2269, 1.2342, 1.2429. The Senkou Span B (1.2003) and Kijun Sen (1.2105) lines can also generate signals. Rebounds and breakouts from these lines can also serve as trading signals. It is better to set the Stop Loss at breakeven as soon as the price moves by 20 pips in the right direction. The lines of the Ichimoku indicator can change their position throughout the day which is worth keeping in mind when looking for trading signals. On the chart, you can also see support and resistance levels where you can take profit. There are no important events or reports planned for Monday in the UK or US. The pair may continue to move at an average pace with a slight upward bias.
Indicators on charts:
Resistance/support - thick red lines, near which the trend may stop. They do not make trading signals.
Kijun-sen and Senkou Span B are the Ichimoku indicator lines moved to the hourly timeframe from the 4-hour timeframe. They are also strong lines.
Extreme levels are thin red lines, from which the price used to bounce earlier. They can produce trading signals.
Yellow lines are trend lines, trend channels, and any other technical patterns.
Indicator 1 on the COT chart is the size of the net position of each trader category.
Indicator 2 on the COT chart is the size of the net position for the Non-commercial group of traders.