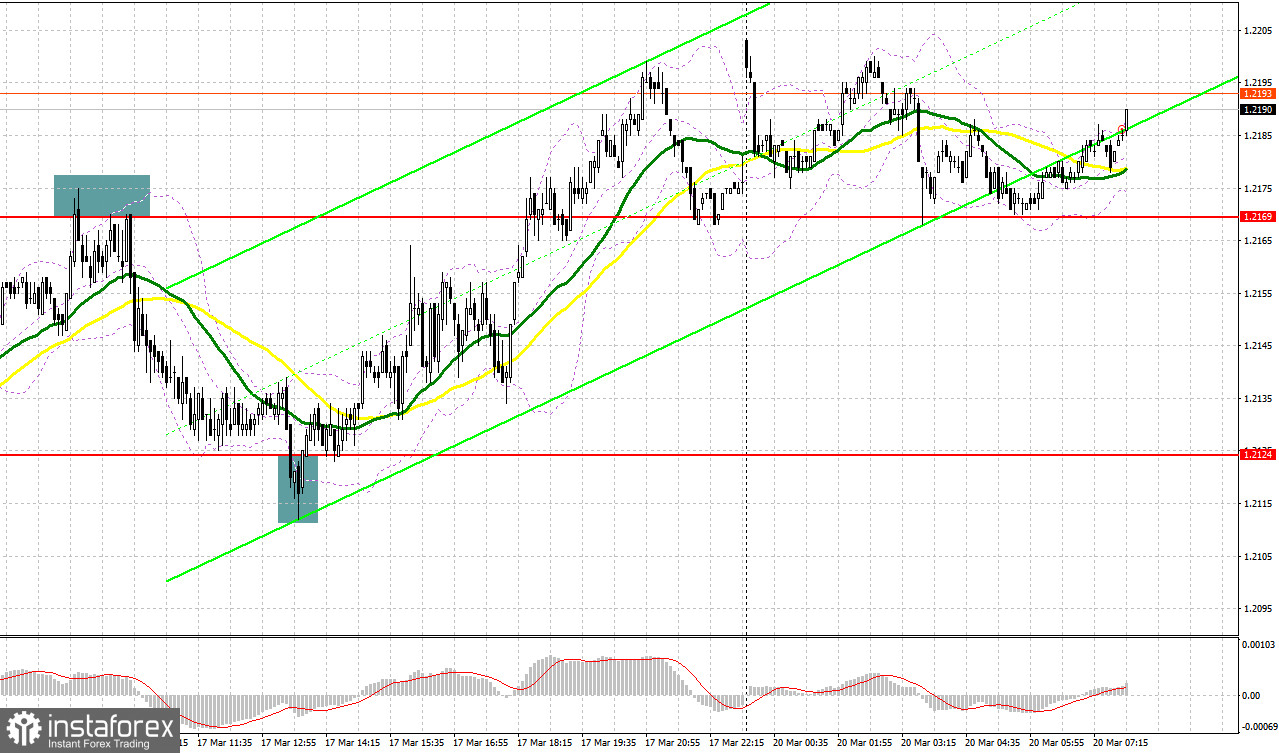
On Friday, traders received several signals to enter the market. Let us take a look at the 5-minute chart to clear up the market situation. Earlier, I asked you to pay attention to the level of 1.2169 to decide when to enter the market. A rise and a false breakout of this level led to a sell signal, which spurred a decline of more than 50 pips. In the second part of the day, protection of the support level of 1.2124 and a false breakout of this level led to a buy signal. As a result, the pair increased by 50 pips.
Conditions for opening long positions on GBP/USD:
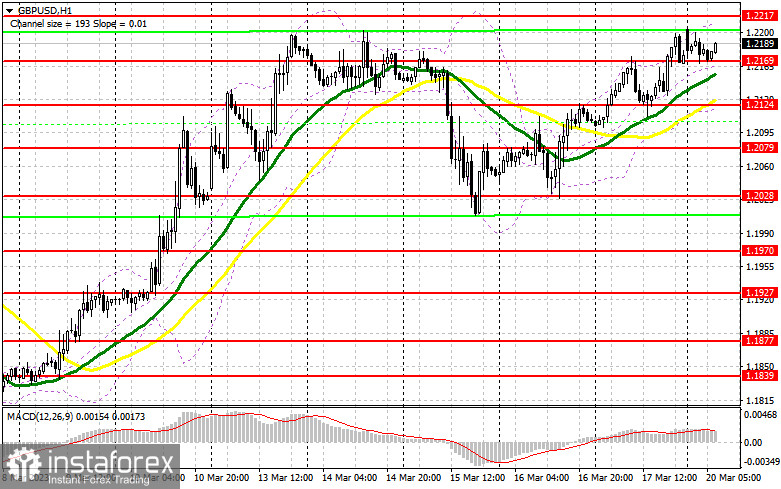
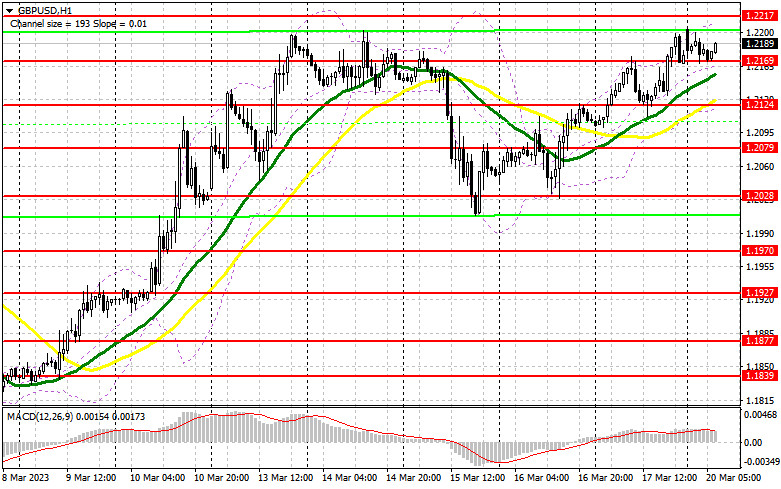
Today, there is no fundamental data from the UK. That is why bulls have every chance to break the monthly high and revive the uptrend. However, it will be better to buy after a decline and a false breakout near a new support level of 1.2169. Slightly below this level, there are bullish MAs. In the event of this, the pound sterling may jump to the resistance level of 1.2217. If the price settles there and downwardly tests this level, the pound/dollar pair may climb to a new monthly high of 1.2265, where bulls may face more serious obstacles. There, it is also possible to buy after a breakout with the target at 1.2131, where it will be wise to lock in profits. If bulls fail to protect 1.2169 pressure on the pound will return. In fact, this scenario is highly possible as this area was tested two times during the Asian trade. In the event of this traders should avoid buying the asset until the price touches the next support level of 1.2124. There, it will be possible to go long only after a false breakout. Traders may also go long just after a bounce off the low of 1.2079, expecting a rise of 30-35 pips.
Conditions for opening short positions on GBP/USD:
Sellers have only one chance to return to the market. If bulls manage to reach the monthly high and go above it, the trend will develop faster. That is why sellers should focus on the resistance level of 1.2217. During the European session, it will be better to go short after a false breakout of this level. This, in turn, will give a perfect sell signal with the target at the intermediate support level of 1.2169. In the event of this, the pair will enter the sideways channel. Only a breakout and an upward test of 1.2169 will intensify pressure on the pound sterling. This will form a sell signal with the target at 1.2124. The farthest target is located at 1.2079, where it is better to lock in profits. If the pound/dollar pair increases and bears fail to be active at 1.2217, they will have to leave the market. Only a false breakout near the next resistance level of 1.2265 will give a sell signal. It is also possible to go short just after a rebound from the high of 1.2323, expecting a decline of 30-35 pips.
COT report
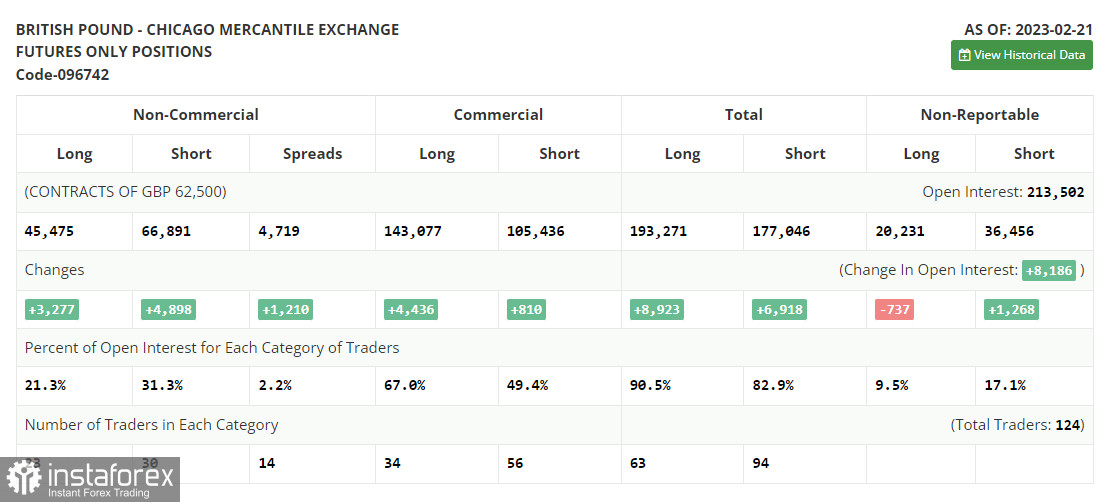
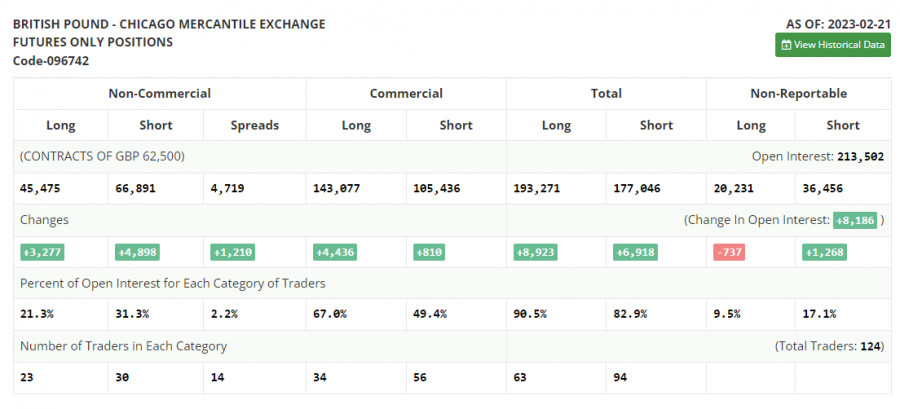
According to the COT report from February 21, the number of both long and short positions increased. Notably, the data is of zero importance at the moment since it was relevant a month ago. The CFTC has just started recovering after a cyber attack. That is why it is better to wait for fresh statistics. This week, all eyes will be turned to the UK labor market reports and average earnings growth. This will help the BoE to decide on the key interest rate hike amid stable inflation. Household earnings growth may keep inflation at the current high level. Meanwhile, the US is going to disclose its inflation figures, which may prove that Jerome Powell will switch to a looser policy. A risk of the US banking sector collapse, which occurred after the BSV bankruptcy, may force the Fed to alter its view on how long it should raise the benchmark rate until the economy becomes damaged. The recent COT report unveiled that the number of short non-commercial positions increased by 3,277 to 45,475, while the number of long non-commercial positions jumped by 4,898 to 66,891. Against the backdrop, the negative value of the non-commercial net position advance to -21,416 against -19,795 a week earlier. The weekly closing price decreased to 1.2112 from 1.2181.
Signals of indicators:
Moving Averages
Trading is performed above the 30- and 50-day moving averages, which points to a change in the market sentiment.
Note: The author considers the period and prices of moving averages on the one-hour chart which differs from the general definition of the classic daily moving averages on the daily chart.
Bollinger Bands
In case of a decline, the lower limit of the indicator located at 1.2124 will act as support.
Description of indicators
- Moving average (a moving average determines the current trend by smoothing volatility and noise). The period is 50. It is marked in yellow on the chart.
- Moving average (a moving average determines the current trend by smoothing volatility and noise). The period is 30. It is marked in green on the graph.
- MACD indicator (Moving Average Convergence/Divergence - convergence/divergence of moving averages). A fast EMA period is 12. A slow EMA period is 26. The SMA period is 9.
- Bollinger Bands. The period is 20.
- Non-profit speculative traders are individual traders, hedge funds, and large institutions that use the futures market for speculative purposes and meet certain requirements.
- Long non-commercial positions are the total number of long positions opened by non-commercial traders.
- Short non-commercial positions are the total number of short positions opened by non-commercial traders.
- The total non-commercial net position is a difference in the number of short and long positions opened by non-commercial traders.