


In trading, every moment counts, because fast reaction is very important in this activity. If a market participant analyzes charts on their own, it can be both time-consuming and useless, because the precious moment can be missed.
This problem can be dealt with the help of special algorithms. You can read more about them in this review: "Forex indicators".
Here we will touch upon the theme of candlestick patterns indicators. You will learn what data it provides, how to use this algorithm for meeting trading objectives, and how to install it on MetaTrader.
Meaning of terms
Before we get directly to the topic of this article, let's explain some basic concepts and terms that may be unknown to beginners. This factor may prevent them from reaching desirable results.
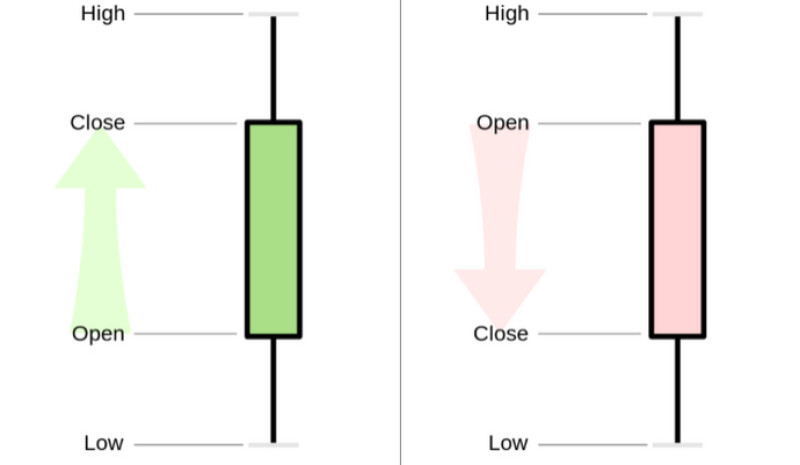
1. A candlestick is a graphical element reflecting the dynamics of an asset, that is currency pairs in our case.
A candlestick provides the following data: the asset price at the time of opening and closing, as well as the highest and lowest price bars. This information is not abstract, but relates to a specific time period such as a minute or a day.
Visually, a candlestick consists of a body and wicks, also called shadows. The body shows the value of the currency at the beginning and at the end of a given period, while the shadows show the highest and lowest price during the same time period.
When analysing a candlestick chart, a trader can find out what price behaviour was in a particular period. If the opening price was higher than the closing one, it would mean that the market is bearish, while the opposite situation would indicate a bullish trend.
The corresponding candlesticks are called bullish and bearish.
2. Essentially, "patterns" means some kind of a sample, which is based on the mechanism of repetition.
Applicable to Japanese candlesticks, patterns are formations that usually consist of two or five candles. They reflect the past price trends that can possibly repeat in the future.
Patterns help traders to understand what to expect in the market next: the trend continuation or a reversal. Based on this data, traders will be able to build their further strategies.
What is a candlestick pattern indicator?
This concept dates back to the 18th century, when rice sellers in Japan used an analog of the current candle models. At the end of the last century, this technique was recovered and became widespread in the trading community thanks to technical analyst Steve Nison.
In his book, he described the effectiveness of using Japanese candlesticks with the main focus was on the financial markets including Forex.
Nowadays, candlestick patterns are popular among traders with different experience and level of training. Their key benefits are accessibility, ease of interpretation, and accuracy of forecasts.
Currently, there is a plenty of candlestick patterns. There are several dozen figures, and each of them can provide different signals in different situations.
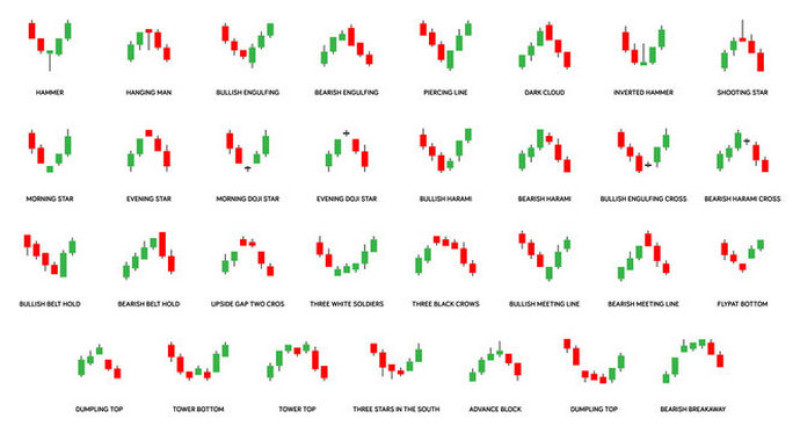
It can be difficult even for experienced market participants to remember such a huge amount of information, not to mention traders who are just making their first steps in trading.
Indicators serve to solve this problem. They automatically inform users about formation of a certain pattern, so all that is left to do is to open a trade at the right time.
When using indicators, traders don't need to monitor charts endlessly. Besides, no special skills or knowledge are required.
Moreover, such algorithms solve the main drawback of candlestick patterns which is subjectivity. After all, different traders can interpret their results in their own way.
For example, one trader may notice a figure in one place on the chart, another may identify it in a completely different area, and the third one may fail to notice it at all. So, the impact of such an interpretation on a trader's deposit is unpredictable.
Advantages of using candlestick indicators for forex traders:
- They save time and effort as a trader does not need to analyze on their own, straining their eyesight. Therefore, they get less tired, while the saved energy can be spent directly on trading, not on searching for patterns on a chart;
- They increase the efficiency of trading. Quick reaction to signals will help a trader to achieve the key goal which is to make a profit;
- Consolidation of knowledge and skills in trading. Sometimes, it may seem that when using a CPI a user does not develop their trading skills, because an algorithm does their job.
In fact, it is not so. Using this tool, a user can eventually learn to identify figures on their own.
Also, it is important to understand that there are several types of candlestick pattern indicators. It is up to traders to decide which one to choose, based on personal preferences and objectives.
No matter what type of indicator a trader opts for, experts advise to use candlestick algorithms together with indicators of other types. This is necessary to confirm their signals, because otherwise there is a risk that a trade will not bring the expected result.
Specifically, they can be combined with a moving average, support and resistance levels, and other tools.
Candlestick Pattern Indicator for MT4 and MT5
Most often, algorithms that identify candlestick patterns are adapted for the most popular MetaTrader 4 platform. However, there are indicators that are compatible with both MT4 and MT5.
CPI is one of such indicators. Basically, it is a rather simple indicator as it just finds a candlestick formation on the chart of a currency pair or another asset and immediately informs a trader about it.
The principle of the CPI operation is based on the following steps:
- Identification of patterns. Read further to find out what patterns in particular.
- Description of each identified pattern;
- Notification of the user: the vector of opening a position is indicated by arrows, and the need to take action is signaled by an alert.
The figures which CPI detects can be divided into two groups. The first group includes those that suggest the continuation of the trend, and the second group warns of the upcoming reversal.
CPI advantages:
- Ease of use: each figure is indicated directly on a chart;
- Efficiency: sound alerts will enable a trader to timely spot an important moment to open a position;
- Versatility: suitable for all currency pairs and any timeframe.
We have mentioned candlestick patterns several times. To understand how CPI works in more detail, let's have a closer look at them.
After all, the direct purpose of CPI is to identify these patterns.
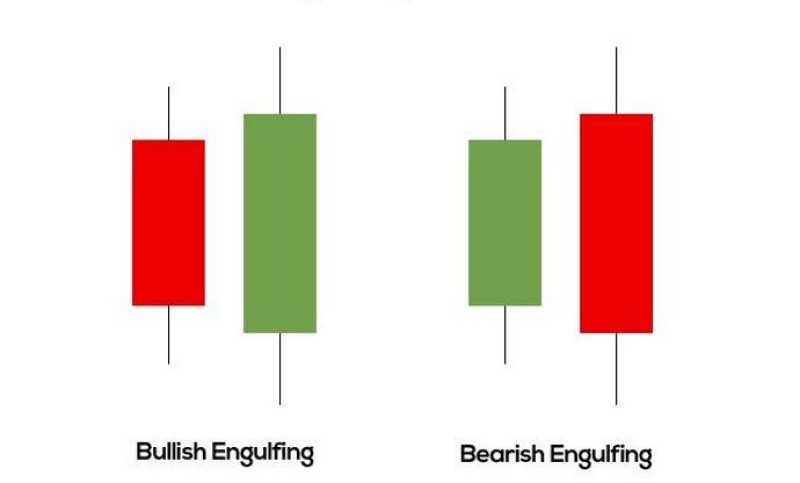
- The engulfing pattern is a variety of a reversal pattern that can be bullish or bearish. This pattern is composite, it includes two candlestick patterns and, as the name implies, one of them is engulfed by the other.
In this case, the shadow of candles does not matter, so the attention should be paid to the body of each candle, particularly, its size and color.
The main condition for the "engulfing" is when the second candle gets larger than the previous one, and both of them have different color.
If the first candle is black (or red) and the second one is white (or green), the bulls dominate the market. If it is the other way around, the bears have the advantage.
In the first case, we can expect a change of direction to upward, in the second - to downward.
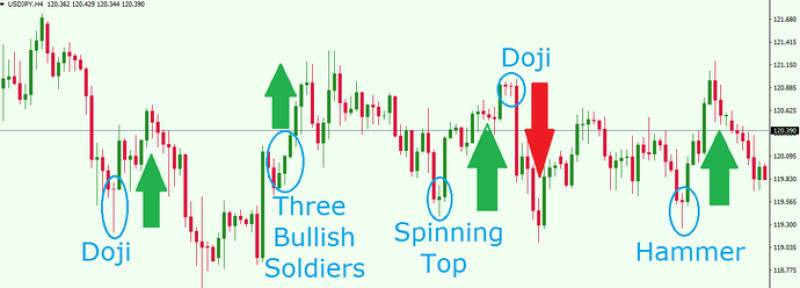
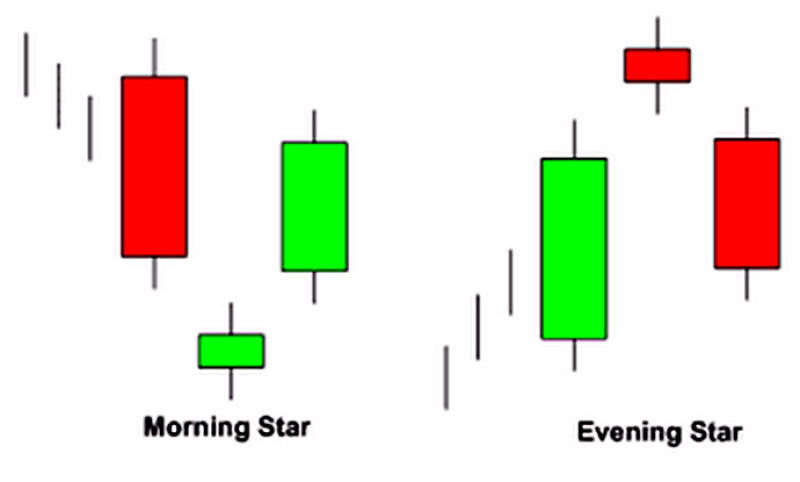
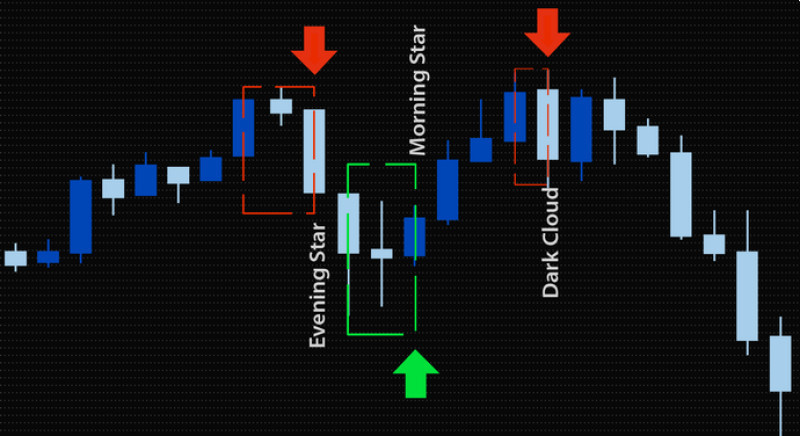
- When the Star pattern appears on a chart, it indicates that the current trend is about to reverse.
The first thing that catches the eye when a "star" appears is a small body of the candle compared to the others. This is the main feature of this candlestick pattern.
The second indication is the color of the preceding candle. If the trend is bullish, it is green or white, if it is bearish, the color is black or red.
This model has two varieties: the Morning Star and the Evening Star. These patterns consist of three candles following each other.
The Morning Star can be seen at the base of a downtrend and be regarded as a signal of an impending change in the price direction. The Evening Star, on the contrary, appears at the top of the ascending dynamics and warns that the trend will change to a downtrend.
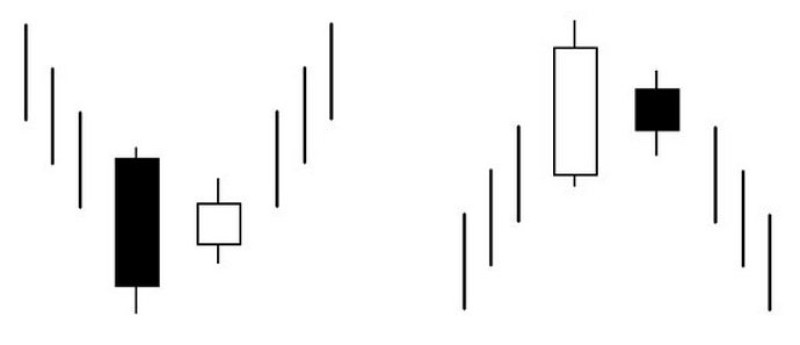
- Harami also belongs to the category of reversal patterns. Most often, such a model occurs at the end of the current dynamics.
The main feature of this pattern is two candlesticks, where the body of the second one is smaller than the previous one, and its size together with the shadows does not exceed the limits of the first one. This variant is quite often called the opposite of the engulfing pattern described above.
At the same time, the color of the second candle is not that important.
When Harami appears, it is the first sign that the current trend is weakening.
This is just a small part of patterns that the CPI indicator can recognize. At the same time, these models can be identified during any trend: either when the price is increasing or, on the contrary, decreasing.
CPI Settings
Too many patterns on a chart may be confusing for traders, so they need to decide which patterns are more convenient to use. For example, if you trade on reversals, then it would be logical for you to look for reversal patterns mainly.
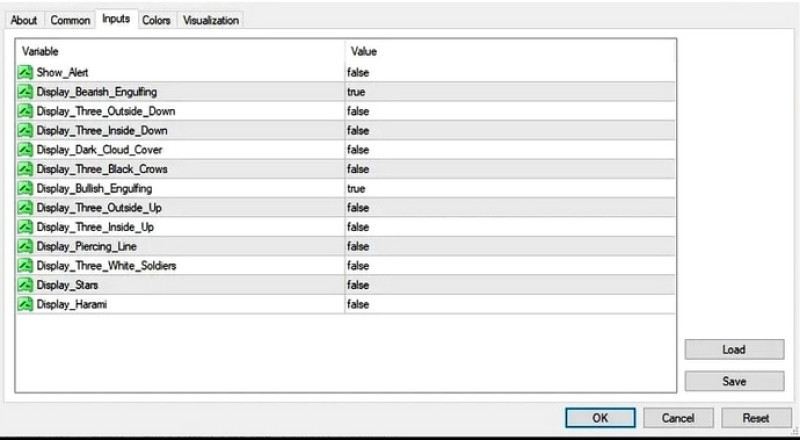
Non-reversal patterns can be disabled which can be done in the settings.
In the settings, you can change the selection of used patterns both before you open a trade and after it. To remove a pattern, click False, and to add it, click True.
In the CPI settings, you also can:
- disable and enable indicator alerts or email notifications;
- activate and deactivate displaying of weak and strong reversal patterns, as well as patterns indicating the continuation of a trend;
- change the number of the last candles for the analysis. Importantly, the older the timeframe is, the more candles you need to use. For example, the optimal number of candlesticks for H1 timeframe is 350, while H4 should have at least 500;
- choose the color of the arrows, as well as descriptions.
These settings can be applied in the Properties section of the Candlestick Pattern.
However, some specialists note that this algorithm does not allow its users to adjust the parameters of candlestick patterns such as their maximum size, the ratio of body to shadow, etc.
How to use CPI in trading?
So how do you correctly plan your trading using the Candlestick Pattern Indicator? It's easy.
First, it recognizes patterns on a chart of a currency pair. After that, the indicator displays the pattern chosen by a trader on a chart and alerts them with an audible signal.
It's better to enter the market following the arrow vector. It appears on a chart at the same time as the pattern.
It is necessary to buy an asset when the arrow is directed upwards and sell it when it is directed downwards. The moment of closing a deal depends on the strength of the pattern and is determined by traders themselves.
When trading, pay attention to the following factors:
- The timeframe should be selected in accordance with the trading strategy. But it is important to remember that on M1, some patterns consisting of a single candle may be of low efficiency due to the market noise.
The most stable results are demonstrated by timeframes from M30 to H1. If a trader uses M1 chart, it is especially important to use additional indicators such as MACD, Fibonacci lines, and other; - The CPI signal occurs when the algorithm has drawn the final candle of the pattern. After that, a trader should follow the tips marked with arrows;
- Most often, it is better to open a trade at the close of the candle that comes next after the pattern;
- The distance from a stop-loss level to the reversal pattern bottom should be at least 15 pips;
- When trading low-volatility assets, a trader may face a situation where the CPI gives very few signals. Therefore, it is better to use this candlestick indicator when trading more volatile assets.
The optimal variant is when there are about 25 candles between two similar signals (either to buy or to sell) - The CPI signals are the most important and show the best results when they are near support and resistance levels. Therefore, it is necessary to use these tools together.
Here is a specific example of how CPI can be used to implement a reversal strategy. This strategy implies profiting from the change in the vector of a currency pair value.
In this example, CPI is used along with the Stochastic Oscillator, which is inbuilt by default in MetaTrader 4 and MetaTrader 5.
The timeframe is 15-minute and the traded asset is EUR/JPY known for its high volatility.
Save the standard settings except:
- Stochastic Oscillator levels should be adjusted at 20 and 80 marks;
- the Candlestick Pattern should be set for identifying strong reversal patterns.
When the CPI informs you of an upcoming trend change, be sure to get a confirmation of this signal. In order to do this, we analyze the Stochastic Oscillator data in order to avoid a wrong move.
If this indicator is out of the overbought or oversold zone, the CPI signal can be considered confirmed. The same conclusion is made when the Stochastic Oscillator stays at the boundaries of these zones.
Next, you need to perform the following actions:
- open a buy trade if the arrow is green. It should be done after the signal bar closes.
A Stop Loss should be placed at the point where the arrow appears. The trade should be closed when the Stochastic Oscillator goes to the overbought zone or the CPI provides the opposite signal;
- open a sell trade if the arrow is red. At the same time, pay attention to the Stochastic Oscillator: it should drop below 80 or come near to this level.
As in the first case, the stop loss should be placed at the point where the arrow appears.
You need to close the trade when the CPI gives an opposite signal or when the Stochastic Oscillator begins moving to the oversold level.
How to install CPI in MetaTrader
Unlike many other algorithms, the Candlestick Pattern is not embedded in the standard set of MT4 and MT5. This means that in order to use it in trading, traders need to install this indicator on their own.
The installation process is the same regardless of what MetaTrader version you use.
To add CPI to you trading platform, you need:
- Download the algorithm to your device and unpack the archive. The downloaded files will have the ex4/ex5 or mq4/mq5 extension.
Inportantly, the indicator archive usually contains a file with detailed decoding of candlestick patterns that it identifies during use; - Launch the platform, and select Data catalog in the File section;
- Copy the unzipped indicator files to the clipboard;
- On the platform, select MQL4/MQL5 – Indicators and paste files from the clipboard to it;
- Re-run MetaTrader.
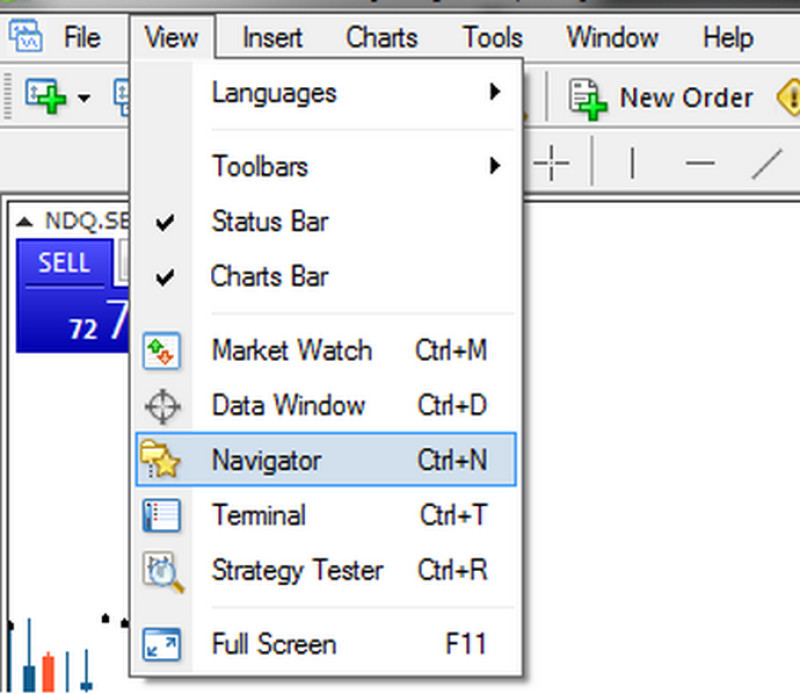
After you complete these steps, the CPI will be available for use. To display it on a chart, you need to drag it to the chart from the Navigator window or click on it in the list of custom indicators in the main menu of the platform.
A simple option is just to down the CPI indicator from the MetaTrader Market.
However, it is important to remember that using the CPI indicator alone is a risky move. Above, we have already mentioned what algorithms should be used in combination with the CPI.
Conclusion
The Candlestick Pattern can be of great help to traders, as it performs the most complex and monotonous part of the analysis of the foreign exchange market.
In addition, the vast function kit of the CPI makes it a more effecient tool compared to other indicators.
At the same time, the CPI is not some magic tool that can ensure your profitable trading free of losses.
Firstly, other indicators are needed to confirm its signals, otherwise there is a high risk of making wrong steps. Secondly, the effectiveness of any tool also depends on a trader's skills.
Indeed, the Candlestick Pattern Indicator can help traders increase their chances of getting profit and simplifies trading to some extent. However, trading skills and expirience are of greater importance.
Read more
Bollinger Bands: strategy and way of use
MFI Indicator (Money Flow Index): complete guide
Awesome Oscillator: how to use
Support and Resistance Indicator MT4, MT5
VWAP Indicator (Volume Weighted Average Price)
MT4 indicators: how to install and use
Forex volume indicators for MT4, MT5
Forex arrow indicators for MT4


