


Profitable trading in the forex market is based on a balance between risk and reward. It can be attained thanks to special algorithms. You can read more about them in the following article: "Forex indicators".
This article will describe support and resistance indicators, the importance of support and resistance areas, and how to use them to trade successfully.
Forex level indicators: key information
Support and resistance indicators are an integral part of technical analysis in the forex market. These algorithms help market players make correct decisions when trading currencies.
The indicators highlight general trends in the FX market and are based on the supply-and-demand situation in a set period of time.
First, let us have a look at the key related terms:
1. Levels are key marks for the asset, where bulls and bears are almost in balance. In these areas, a correction slows down or stops entirely.
When the asset reaches these levels, it can very likely change the direction of its movement, as either bullish or bearish traders take the initiative in the market.
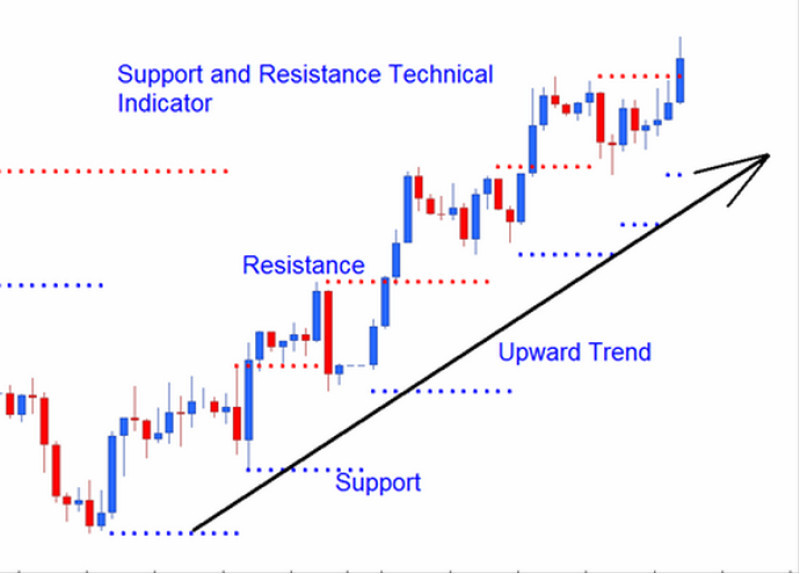
2. A support level is a line connecting several swing lows of an asset. When the asset dips towards it, bulls begin to wrestle control of the market from bears.
Support lines indicate the lowest price of an instrument and serve as an obstacle for its downward movement.
3. A resistance level, on the other hand, marks the highs of the asset. When the instrument pushes against this line, bearish traders take the initiative from bulls.
The more times the asset tests the resistance and bounces off it, the stronger the level is.
4. Indicators are algorithms based on mathematical data about the asset. These tools are used to assess the quote’s past performance and forecast its price dynamics.
The forex market is virtual in nature, but the price dynamics of its assets are determined by real people – bulls and bears. Bullish traders or bulls expect a currency to go up, while bearish traders or bears think the currency will go down.
Bulls and bears struggle for dominance to protect their investments during the trading session, disrupting the supply and demand balance.
When the asset reaches the resistance area, bulls begin to actively open long positions. Bears close short positions and sell the asset in support areas.
Trades by major market players can significantly affect the situation in the market and create new key levels.
How it works in practice
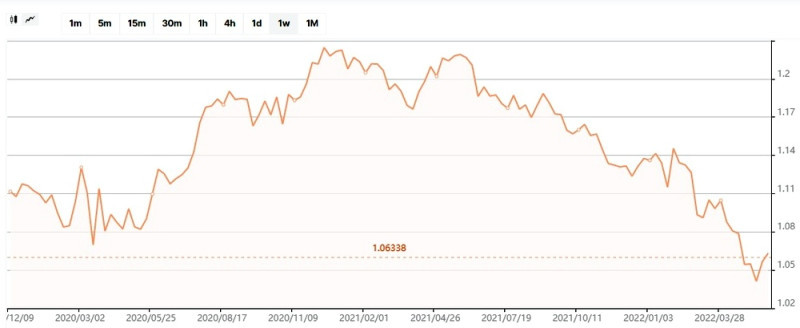
If we look at a chart of any currency pair, we can see that its price is always moving.
Novice traders could assume the pair’s price moves chaotically and does not follow any patterns. However, it is not true.
When the pair moves to a certain point and then reverses upwards, it means it has reached its support range.
The more times the instrument fails to break through it, the stronger the support level is.
Similarly, when the pair hits its high, it means the instrument has reached its resistance level.
The currency pair frequently bounces off this level and moves downwards, indicating a trend reversal.
The more times the pair tests its support and resistance levels, the more precise are their boundaries. This allows traders to see the pair’s price dynamics over time.
Furthermore, support and resistance zones are key psychological levels as well. Market players prefer to carry out transactions within their boundaries, reinforcing these levels further.
Support and resistance levels are essential for traders. If the instrument approaches the resistance level, it will likely fall afterwards. In this situation, bears need to open short positions.
Similarly, bullish traders step in when the quote tests the support level.
When analyzing the instrument’s movements, traders must look for a confirmation of a trend reversal, such as reversal patterns.
When a quote tests its support or resistance, it can break through these levels and hit new extremes.
Therefore, traders must look for candlestick patterns, indicator data and other signals to avoid mistakes.
Support and resistance levels are used for the following tasks:
- Determining the price direction,
- Determining the optimal level for setting up a stop-loss order;
- Forecasting a trade’s potential profit.
Some market players trade within the price channel formed by support and resistance levels, while other use these levels in different strategies at various time frames.
How to use Forex level indicators when trading
Many trading strategies used by both novice and experienced traders are based on support and resistance levels. These strategies are feasible only if the trader determines support and resistance levels correctly and chooses the correct risk/reward ratio.
To fulfil these criteria, a trader must thoroughly analyze their trading plan and mistakes.
It should be noted that support and resistance play a key role when trader activity in the market is high, particularly after important new reports, as well during periods of higher trading volume and volatility.
When large market players place large orders in the book order, it may also indicate a key level.
When trading volume is low, the instrument may hover near support and resistance levels without showing any trend signals.
In this situation, traders must exercise caution and treat key levels as a price range and not as a definite price level.
Here are some other factors that should be considered when trading using support and resistance:
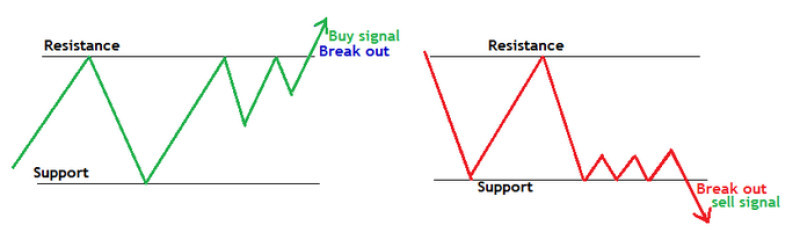
1. Always wait for the level to be confirmed. A market player must be sure if the price bounced off the level or performed a breakout.
Otherwise, trading breakouts will be extremely risky.
2. You should open short positions if the quote bounces off its support and moves upwards;
3. It is time to sell the asset if the asset’s support level becomes the new resistance level after a breakout.
4. Short positions can be opened when the price bounces off the resistance level downwards.
5. If the old resistance level becomes the new support after a breakout, you should go long on a currency pair.
6. Stop Loss orders must be set above the resistance when you’re opening short positions, and below the support for long positions.
Support and resistance levels are used in the following trading strategies:
- Bounce trading, which is most often employed when the instrument is in a sideways trend. Using indicators, traders go long on a currency when it tests its support and open short positions when it reaches its resistance level.
In this scenario, stop-loss orders are set below the support range for long positions and above the resistance for short positions.
Traders can take profit immediately when the quote bounces off key levels. However, they can also adjust the Stop Loss order and wait for a bigger bounce.
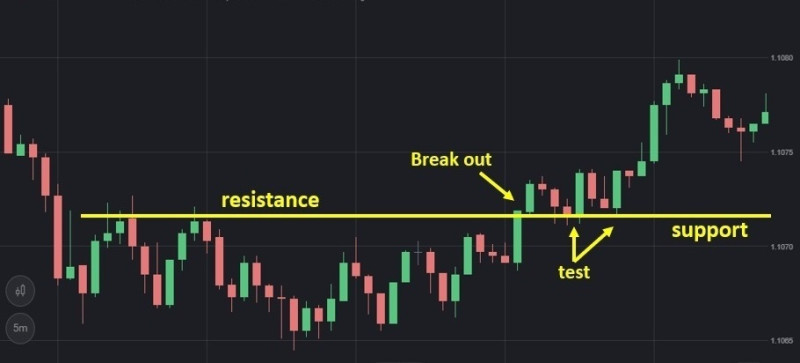
- Breakout trading is used when the quote breaks through the key zone. Breakouts usually happen during important economic events and periods of higher trading volume.
In this scenario, the price moves towards new extremes, which are considered by traders when planning new trades.
According to experienced traders, the best course of action in this situation is to wait for a short while. When the quotes test the support, you should wait for the price to fall even further.
Both bounce trading and breakout trading can be combined – you do not have to commit yourself to only one strategy.
It all depends on the market situation, the accuracy of the forecast, and a trader’s personal preferences.
Forex level indicators
Finding support and resistance levels takes time – it is an extremely difficult task for novice traders due to their lack of experience.
In this situation, any mistakes will lead to heavy losses.
To make finding key levels easier, traders use indicators that set support and resistance automatically.
Furthermore, they eliminate trader biases that could affect their decision-making process.
A number of such indicators exist. Some of them are pre-installed in popular trading platforms, such as MetaTrader 4 and MetaTrader 5. They show lines connecting extreme points on the chart.
The indicators can also highlight an area between levels on the chart, set levels at several time frames, and other features, depending on the tool in question. MetaTrader comes with the following built-in indicators by default:
- Fibonacci levels, which help traders determine strong support and resistance areas, as well as potential corrections. This indicator is used at various time frames.
- Moving average indicators, which are generally used on higher time frames.
- Price channels – a trading range between two parallel lines on the chart.
Let us have a look at several other indicators to examine their use in detail:
1. The Zone indicator, which automatically plots levels of strong support or resistance on the chart. Besides showing highs and lows of a quote, this indicator also plots the instrument’s projected performance in the future, when used alongside oscillator tools.
The indicator draws several rectangles on the chart. Their vertical edges represent key areas. Support and resistance zones are determined for various price levels.
Trading using this instrument is similar to level trading in general. When the price bounces off its support, traders should open long positions.
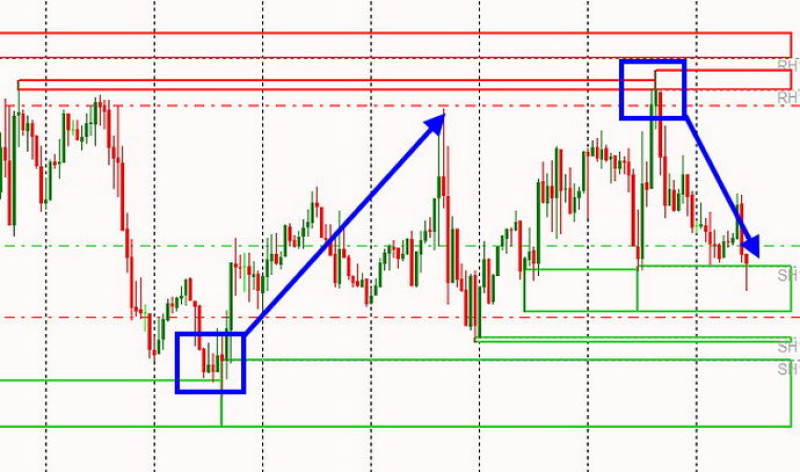
However, these trend reversals should be confirmed by corresponding reversal patterns.
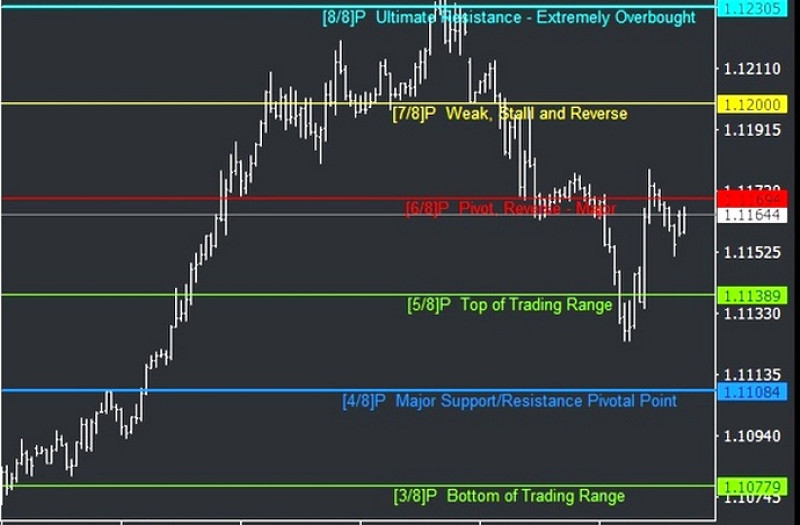
2. Math System Trader is based on a concept developed by T. Henning Murrey. This is a leading indicator which displays information without repainting, which makes its signals more accurate.
Furthermore, all key areas are marked with text labels and are highlighted with different colors.
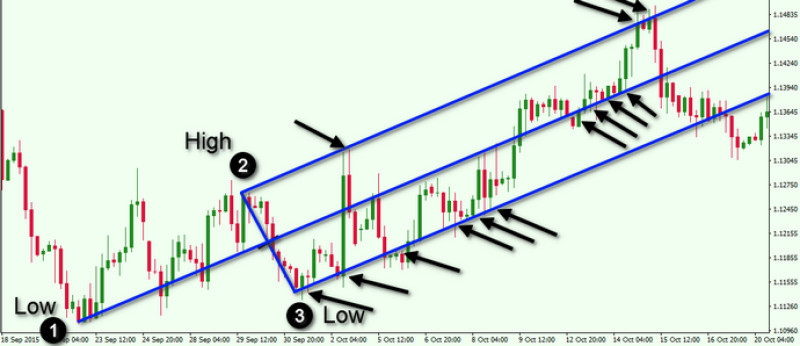
3. Andrews' Pitchfork is an indicator that uses three parallel lines to show the quote’s trend.
During an uptrend, the indicator’s lines are plotted from two latest troughs and one of its peaks. The second and third points form a price channel, with its lower and upper lines denoting support and resistance.
4. Ichimoku Kinko Hyo is an indicator created by Japanese journalist Goichi Hosoda under the pseudonym Ichimoku. It consists of four lines. However, support and resistance are marked by two of them, called the Senkou Span.
The colored area between these lines denotes support and resistance areas.
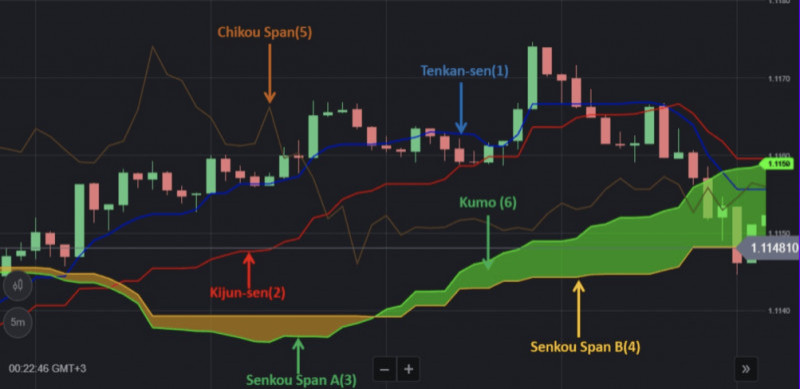
When the asset is moving above this zone, it is in an uptrend, and vice versa.
During an uptrend, the upper and lower boundaries of the colored zone mark the first and second support levels, respectively. During a downtrend, these boundaries denote resistance levels.
5. The ACD indicator is one of the most simple and multifunctional algorithms used by traders. It focuses on a price channel and helps to determine the exact moments the asset reverses course.
When the quote bounces off the upper line, you should open short positions. A bounce off the lower line is a buy signal.
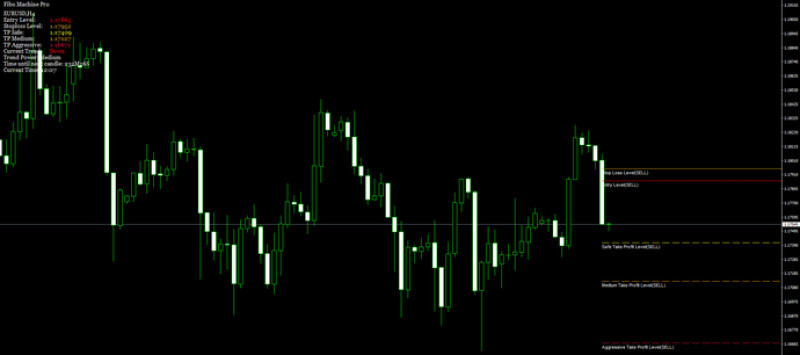
6. Fibo Machine Pro is a highly automated indicator based on the Fibonacci theory.
The indicator’s lines denote support and resistance and indicate the recommended actions. Fibo Machine Pro also provides information on trend directions.
How to avoid mistakes
As stated earlier, support and resistance areas are key when trading in the forex market. However, a trader must not rely solely on key level indicators when making decisions because it could likely lead to heavy losses.
The following must be considered when using such algorithms:
- Do not hurry to open a position when the price approaches a key level. You should wait for the confirmation of the reversal before going long or short on the instrument. Although the price is more likely to bounce off the key level instead of breaking through it, care should be taken.
- The strength of key levels is best seen on higher time frames. The instrument’s performance near these levels can be clearly seen on lower time frames.
- When trading intraday, key levels should be identified on D1 or H4 charts.
- Do not use as many indicators as possible. Using a few high-quality algorithms is the best course of action.
- Do not hesitate to set Take Profit and Stop Loss orders to limit risk and prevent losses.
- Beginner traders should use a demo account for learning the basics of trading. When starting out trading using real money, do not make large trades.
- No indicator can guarantee profits with 100% precision. No matter how experienced you are, as well as what strategy and indicator you employ, you should always follow risk management principles.
Conclusion
This article covers the importance of key levels and how they are used when trading in the forex market, as well as the indicators that identify key levels. These levels are crucial when trading on Forex for several reasons.
All successful market players use key levels when trading. They help determine the situation in the market, its momentum, and the sentiment of other market players.
Key levels are one of the integral factors determining a trader’s profit, indicating entry and exit points.
Trading platforms already come with various key level indicators pre-installed. Additional algorithms for your trading platform of choice can be downloaded online.
Read more
Bollinger Bands: strategy and way of use
MFI Indicator (Money Flow Index): complete guide
Awesome Oscillator: how to use
Support and Resistance Indicator MT4, MT5
VWAP Indicator (Volume Weighted Average Price)
MT4 indicators: how to install and use
Candlestick patterns Indicator for MT4, MT5
Forex volume indicators for MT4, MT5
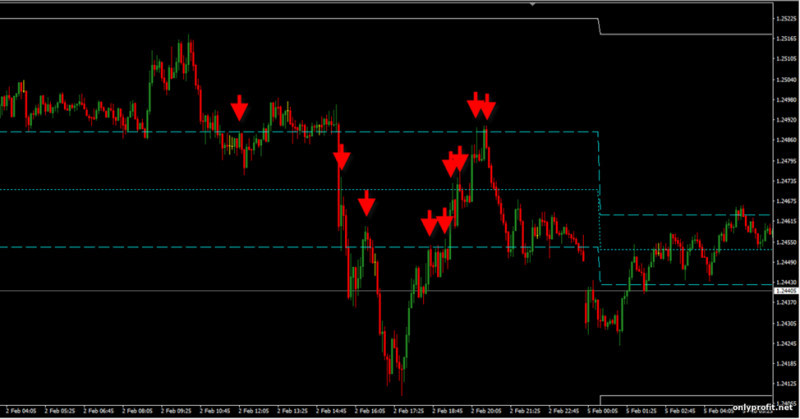
Forex arrow indicators for MT4


