


In the markets, trading is conducted with the help of technical analysis. For this purpose, plenty of indicators have been designed, and each of them serves a different function. Some of them can identify a trend, while others can show a reversal, and so on.
The article "Forex indicators" provides a detailed insight into technical indicators, their types, as well as their advantages and disadvantages.
In this article, we will take a closer look at the Wolfe Waves indicator.
About Wolfe Waves
Named after its creator, Bill Wolfe, Wolfe Waves are based on Newton's Third Law, saying "for every action, there is an equal and opposite reaction."
Wolfe Waves are neither a trend indicator nor an oscillator. It is used in wave analysis.
Still, it can be combined with trend indicators and oscillators to confirm buy and sell signals.
A Wolfe Wave is a wedge pattern composed of several lines headed in different directions. The pattern is either moving up or down.
A bullish wedge pattern signals to buy an asset, while a bearish one indicates to sell it.
It is also important that the pattern is at an acute angle of approximately 40-50 degrees. It would be wiser not to trade if the angle is different.
With its pattern based on strict rules, a Wolfe Wave can show a reversal.
This indicator can be applied to any time frame and any asset, including Forex.
The price moves either up or down on the chart. Such a movement may seem chaotic, but having the right skills, a trader can find certain tendencies on the chart.
With the help of this tool, such tendencies can be seen when patterns are formed.
How to draw Wolfe Waves
What is a Wolfe Wave and how to find it on the chart? Let’s look at a bullish Wolfe Wave first.
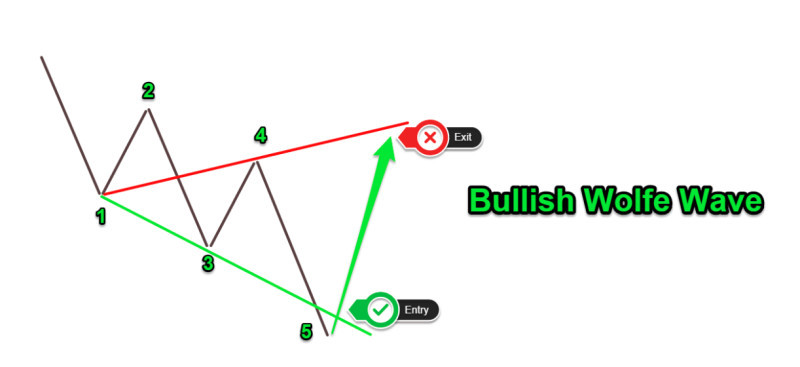
There is a starting point 1. This is one of the lows. On the opposite side, there is point 2, and this is the high.
Point 3 is placed even lower than point 1, and it is the next low. Point 4 should be above point 1 but should not reach point 2.
A Wolfe Wave is composed of these four points on the chart. Next, the sides of the wedge pattern are built.
The line drawn between points 1 and 4 goes upward and sets the mark for point 6, which is the target point with the highest profit.
The line between points 1 and 3 goes down and sets the level for point 5, which is placed below point 3 and is considered an entry point, with the last wave forming there.
With this indicator, trading is carried out in the section between points 5 and 6.
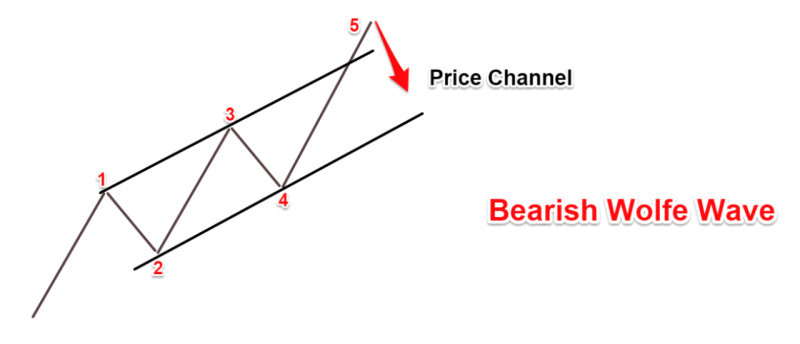
When the indicator is moving down, point 1 shows a rise in the price, with point 2 being the first low.
Point 3, which is above point 1, is the next high. Point 4 is below point 1 but above point 2.
Connected points 1 and 3 form a wave section that sets the direction and the level for point 5. This is where a bearish wave starts to build up and an entry point is created.
Point 6 is placed on the descending line between points 1 and 4. This is the point of the pattern’s end as well as the exit point.
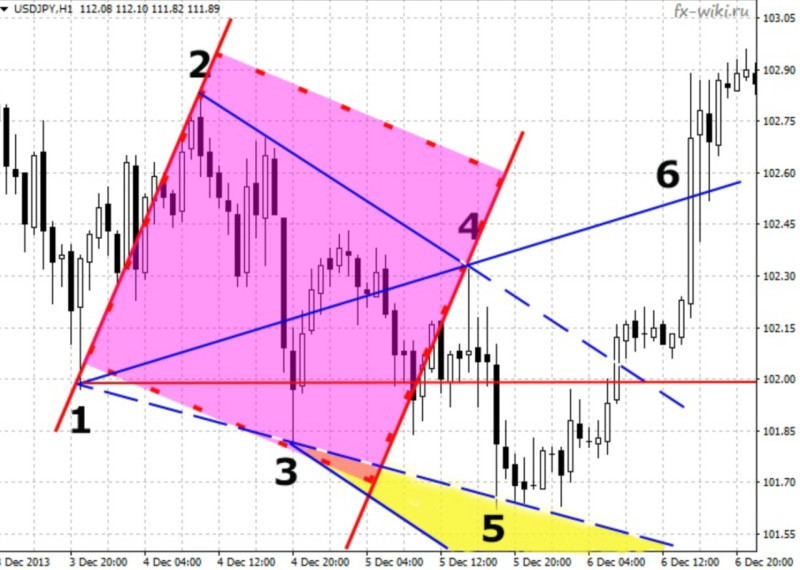
Additional points and zones
Certain structures on the chart do not always line up clearly along the lines drawn between the points mentioned above.
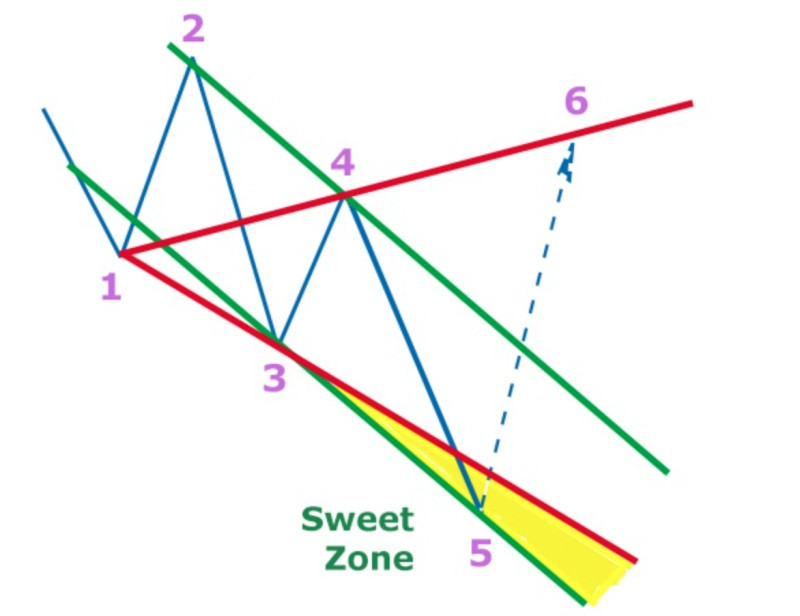
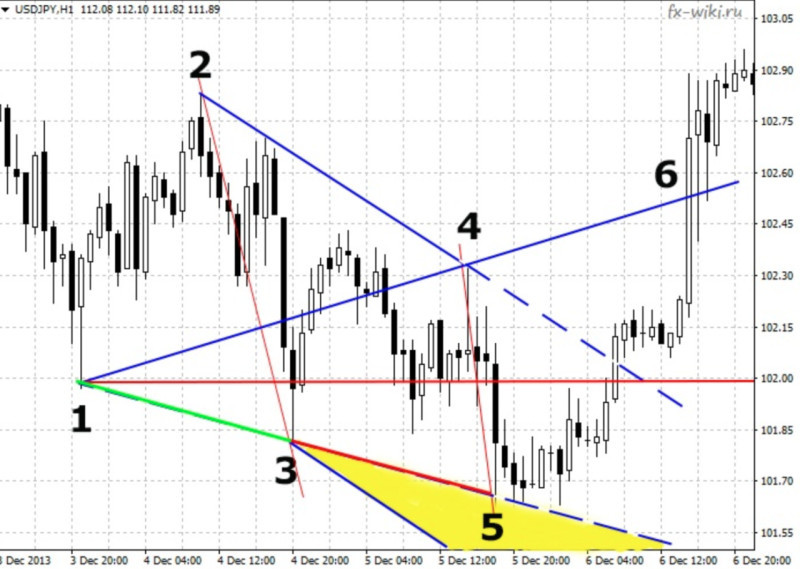
Oftentimes, point 5 is located slightly lower or higher than the section between points 1 and 3. The area between the line and this point is called the "sweet zone" or "tasty zone".
A trade opened in this zone brings the biggest profit.
Additional lines can also be drawn and additional points defined on the chart. One such section is the line that is plotted between points 2 and 4.
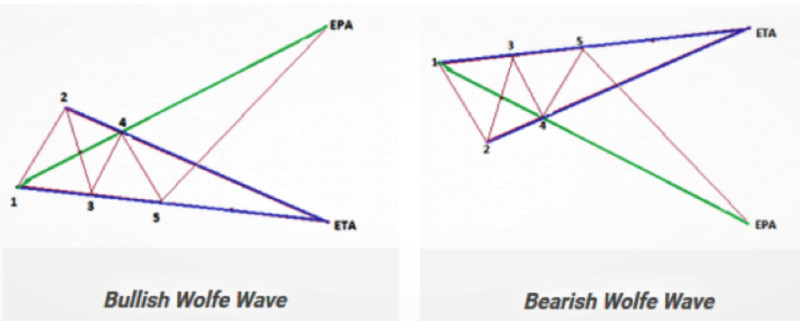
An additional line is called EPA (Estimated Price at Arrival), while an additional point is called ETA (Estimated Time of Arrival).
This point is placed at the intersection of the EPA with a line drawn between points 1,3, and 5. It shows a profit-taking level.
Once the ETA is found on the chart, a trader could close a trade without having to wait until the price reaches point 6.
Moreover, if this point cannot be placed, for example, because point 3 is below point 4, it would be wiser not to enter the market at all.
The use of this point and the line is optional when applying this indicator. Still, they are very useful additional tools for a trader.
Wolfe Waves vs Elliott Waves
Elliott Waves are also used in wave analysis. They are based on the theory that the market moves in waves, that is, its movements have some kind of repetitive patterns.
Some traders consider wave theories to be outdated because of the human factor that affected the market in earlier periods. Meanwhile, there have been even more factors influencing the markets lately.
In this light, the Elliott Wave Theory becomes less relevant. In addition, many traders find this method more difficult to use than Wolf Waves.
According to the Elliott Wave Theory, five waves move in the direction of the main trend (impulsive waves), followed by three waves in a correction (corrective waves).
Fluctuations can be of a different length: extended or compressed. Moreover, each such fluctuation is part of a larger wave of the same direction.
Traders usually struggle to find corrective waves.
Meanwhile, Wolfe Waves are composed of just 5 waves, while trading is carried out only with the last of these waves.
The Wolfe method can help find a reversal on the chart, which is its main similarity to the Elliott Wave Theory.
Both indicators can be used in combination to confirm each other's signals.
Advantages and disadvantages
Each strategy and technical indicator has its pros and cons.
Here are the advantages of Wolfe Waves:
- The indicator is good on its own. It does not require the use of other indicators to make a signal. On the contrary, its developer recommends removing all unnecessary data so that nothing distracts a trader from searching for patterns on the chart.
- The rules of opening and closing trades are quite simple. A trader just needs to find points and draw lines between them. This is the way to receive entry and exit signals.
- By determining patterns correctly, a trader can yield a high-enough profit. The indicator shows reversals rather accurately, and this moment can be used for reaping the maximum profit.
- Low risks. The risk-profit ratio is 1 to 3, and sometimes even higher.
This brings us to the tool’s disadvantages:
- The indicator is not for beginners. Its use requires certain experience in trading. It takes at least a year to learn how to apply it properly. This is because inexperienced traders find it difficult to see patterns on the chart.
- Subjective factor. Although there are strict rules for finding points and drawing lines on the chart, this process is still very individual. Different traders may see patterns in different places on the same chart.
- Waves can be less defined. Ideally, patterns are quite rare when actually trading. It can be confusing when the points on which the lines are based are unclear.
- Psychological factor. Since this indicator is about trading on reversals, holding a position against the general trend can be difficult. This contradicts a popular saying that the trend is a trader's friend.
How to find perfect wave
Ideal wave structures are quite rare. However, there is a number of features indicating that the wave is correct and will bring a good profit.
1. Point 2 should be the high of an uptrend and the low of a downtrend. If this condition is met, a trade will be more profitable.
2. The wedge pattern should have an acute angle, an obtuse angle is unacceptable. Also, the sides of the wedge should be symmetrical to the central point.
3. Section 3, formed between points 3 and 4, must be shorter than section 1, formed between points 1 and 2.
4. Point 3 should be inside the zone between the section formed by points 1 and 3 and the section drawn parallel to it through point 4.
5. The section between points 2 and 4 should not run parallel to the section between points 1 and 3. They should intersect, even outside the chart. At the same time, waves should be pointed upward in a downtrend and downward in an uptrend.
6. Point 5 should be either on the line between points 1 and 3 or just below it, in the so-called "sweet zone". A trade will be profitable in this case only. If the point goes beyond the sweet zone, a trade should not be opened.
7. The section between points 1 and 2 should be parallel to the section between points 3 and 4. This does not always work, but traders should pay attention to this feature anyway.
8. The line between points 4 and 5 should be as short as possible, containing the minimum number of candlesticks. If this line is extended, this pattern is likely to bring a smaller profit.
9. Points 4,5, and 6 should be closer to each other than points 1,2, and 3. The closer the points, the more likely a pattern will work.
10. The section between points 4 and 5 should be shorter than the section between points 2 and 3. The shorter the wave, the higher the profit, which is in line with the eighth feature on the list.
11. The distance between points 3 and 5 should be shorter than the distance between points 1 and 3. If this distance is the same or greater, a pattern is unlikely to work.
Wolfe Waves automation
Automated trading saves traders’ efforts and time, with special computer programs carrying out some basic operations.
The ability to tirelessly analyze large amounts of data is a clear advantage of trading robots and expert advisors. They know no stress or emotional upheaval and are based on a strictly-set algorithm.
Elliott Waves are believed to be quite difficult to automate. Due to various possible scenarios, a computer program cannot foresee all of them.
Wolfe Waves, on the contrary, can be automated. The indicator is based on stringent rules of line formation.
Traders sometimes find it hard to identify the points on which sections are built, so programs have been developed that can do this for them.
WolfWavesFinder is one of the most popular programs that find waves on charts.
This tool detects the peaks of price movements on the basis of which wave sections are built and determines target levels.
The ability to show not only the current but also the previous waves is one of the main advantages of this tool.
When the indicator is used for trading on various charts, and a pattern is built on one of them, the tool sends a signal to a trader by showing the pattern. The trader, in his turn, decides whether to enter the market or not.
At the same time, this indicator has one big disadvantage – it is costly.
WolfWave-nen-2 is a similar but free indicator. However, it is inferior to WolfWaveFinder.
Traders using automated trading with this indicator should always control their risk levels and ways of identifying reversal points.
How to develop Wolfe Waves strategy
Traders who want to yield solid profits in financial markets should have a trading strategy.
A trading algorithm is a set of rules for identifying entry and closing moments and more.
A trading strategy does not guarantee that a trade will be profitable. However, one thing is clear, the general result for a certain period of time will be profit.
A Wolfe Wave strategy is a set of strict rules for finding points on the chart and drawing lines between them.
In addition, it is a universal indicator. Short-term and long-term strategies for various time frames and assets, including currency pairs, can be designed with its help.
The fact that analysis is carried out in the course of trading is the indicator’s benefit. Many other strategies require preparation and analysis before trading.
It does not mean that no preparation is needed. Rather, experience is more important.
Only practice can help a trader detect the beginning of a pattern.
Without experience, traders can see patterns that do not actually exist on the chart. Consequently, it leads to losses.
Therefore, this indicator is for professional traders who know what Forex is and how it works.
Rules of using Wolfe Waves
Here are the rules for using Wolfe Waves that can make trading efficient and successful.
- Be patient, careful, and strictly follow the plan. Since trading with this indicator is against the trend, traders can feel great temptation to get out of this way. But you need to go all the way to the end, only then you can get the desired profit.
- Use volume indicators. Moments, when tick volumes begin to change, can confirm a signal: they decrease on movements and increase on reversal points.
- Pay attention to strong movements on the chart, they can bring the maximum profit.
- Wolfe Waves can be used for chart analysis in several time frames at once. When trading in a higher time frame, small fluctuations that occur in lower time frames do not matter. However, when trading on a lower time frame, a trader gets a strong signal from a higher time frame, the signal is worth considering.
- Trade intraday in M5 and M15 time frames.
- Avoid additional indicators on the chart. This indicator does not require the use of other tools as they can distract and confuse a trader, with the exception of volume indicators.
- Even if you find an ideal Wolfe Wave, you should still place orders Stop Loss and Take Profit. This way you can minimize losses and get a profit.
- Do not trade when price gaps appear on the chart, especially if you are a beginner trader.
- Remember that a new wave structure cancels the previous one.
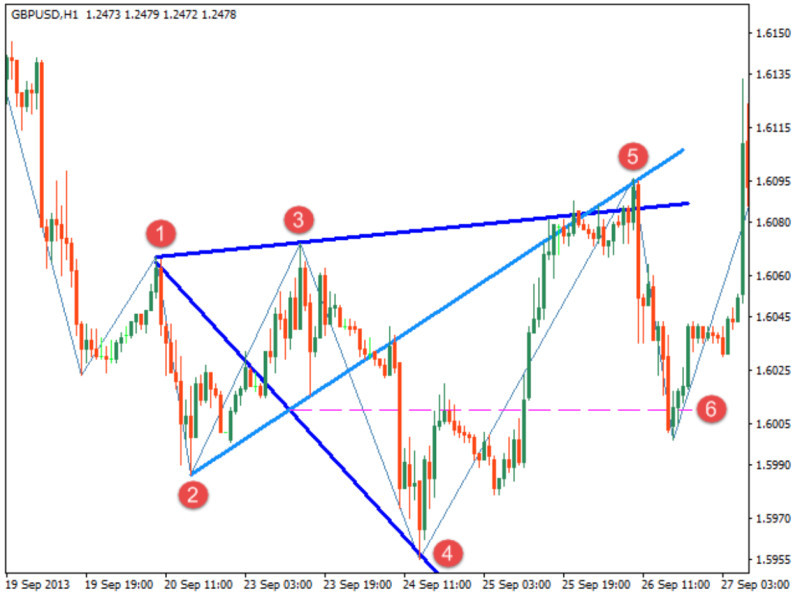
10. Use a secret technique to determine point 6 under imperfect conditions. An additional line should be drawn between points 2 and 5. A place where this section intersects with the section between points 1 and 4 is point 6.
Final thoughts
This article is about the Wolfe Waves indicator.
The tool has its advantages and can bring solid profit when used properly. That is why it is for experienced traders only.
Of course, this indicator is very subjective: on the same chart, different traders can see different patterns or see nothing at all.
At the same time, there is a clear algorithm and strict rules for determining points on the chart, on the basis of which the lines are drawn. A pattern formed with their help can identify reversal points.
With the indicator, a trader can make significant profits, especially if a trade is opened in the so-called "sweet zone".
The theory is no practice, so it can be quite difficult to find and build ideal structures on the chart. However, there is a number of features that can help you find the perfect pattern.
Unlike Elliott Waves, Wolfe Waves can be automated. In this case, a trader decides when to enter a trade, while a computer program searches for patterns on the chart.
Trading strategies based on this indicator are universal and can be used for trading in any market and in different time frames.
Plus traders analyze and find patterns in the course of trading.
Read more
Bollinger Bands: strategy and way of use
MFI Indicator (Money Flow Index)
Awesome Oscillator: how to use
Support and Resistance Indicator MT4, MT5
VWAP Indicator (Volume Weighted Average Price)
MT4 indicators: how to install and use
Candlestick patterns Indicator for MT4, MT5
Forex volume indicators for MT4, MT5


