


Who do you think has more work to do: investors or traders? It is a painstaking job to monitor quotes, but it won’t be long before the first reward comes.
It is a bit more complicated when it comes to investments: money is held for years without a guarantee that investors will get the desired return.
If you want to learn more about different types of charts in trading and investing, read our Trading Charts.
Types of charts
Charts have more information in them than it might seem at first glance. They show more than just price fluctuations that usually occur in cycles.
The price itself has different characteristics:
- an opening price shows the value of an asset at the beginning of the time interval;
- a closing price shows the value of an asset at the end of the time interval;
- a minimum price reflects the value of the smallest trade over the given time period;
- a maximum price reflects the value of the biggest trade over the time period;
- a weighted average is the average price of an asset traded over a specific period of time.
Different types of charts show different price characteristics. Some of them are based only on one price type while others include several aspects.
Depending on the appearance and the amount of information displayed, charts can be divided into 10 groups. Yet, there are three types of graphs that are most commonly used: a line chart, a Japanese candlestick chart, and a bar chart.
A line chart is considered to be the simplest one in terms of representation. It is based only on one price characteristic such as the closing price in a particular time interval. Traders can also choose highs or lows or a weighted average.
This type of chart provides a clear picture with no unnecessary details. It can be used in combination with several indicators and helps avoid confusion.
Yet, many traders prefer to monitor fluctuations of the price on a bar or a candlestick chart. These charts depict several price characteristics at once in a specific time period (open, close, max, and min).
Moreover, candlesticks turn white/green or black/red depending on whether the price has declined or increased over a certain period of time.
Bar charts are very similar to candlestick charts. They present the same type of information as candlesticks but in a slightly different way. A bar chart has small vertical lines that show the open and close of the price.
Asset types
When talking about how to read investment charts, we need to specify what assets professional investors tend to choose. Let’s discuss the main types of assets.
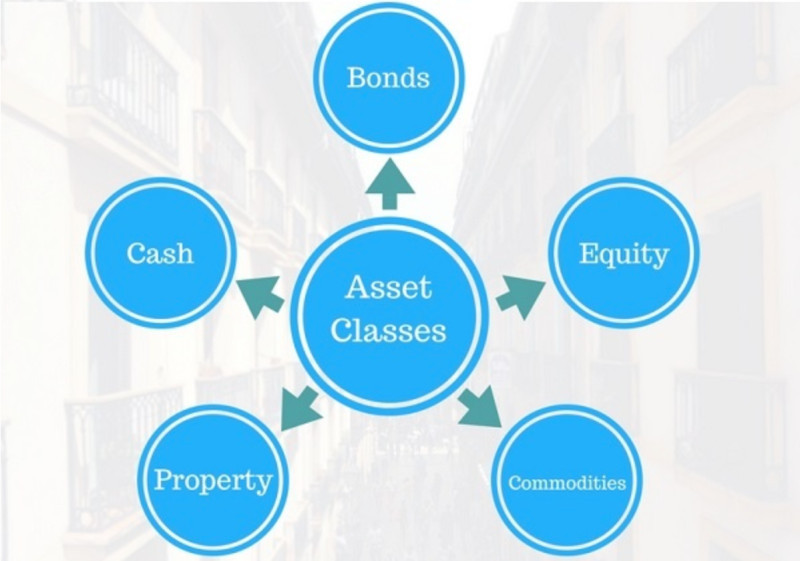
1. Cash. Many people still prefer to store their money in cash and do not trust banks or other financial organizations. Foreign currency is believed to be the most liquid asset which could be exchanged at any moment.
In general, this is a good investment, especially if you keep several currencies in cash. Yet, your cash savings can lose their value over time due to inflation. Besides, you can’t get any return from them such as interest on savings, for example.
2. Bonds are considered low-risk investments but with a low return. When investing in bonds, owners often get them with a discount and receive interest payments.
3. Stocks are high-return investments represented by a large variety of securities of companies from different sectors.
When buying a stock, investors actually get a share in the company. Of course, they can’t influence the company’s policy with just a few stocks in possession but they still can get dividends and other payments.
4. Property, or real estate, is an asset class with the lowest liquidity. It includes commercial real estate, land plots, and residential premises. Real estate is generally considered a safe and reliable investment option and serves as a hedge against inflation.
At the same time, such investments require large initial capital. And after you buy it, you still need to pay for its maintenance and utilities.
5. Commodities are a broad category of assets that include precious metals, oil, coffee, and much more. The value of these assets is usually influenced by various global economic events.
6. Intangible assets include brands, copyrights, patents, intellectual property, etc. Some experts also include knowledge of foreign languages, social connections, and acquaintances that can contribute to investor’s success.
Simply investing cash is not enough for acquiring intangible assets. They also require talent, skills, abilities, and time. Besides, such assets are not always easy to monetize.
How to choose an asset
“Don't put all your eggs in one basket” is the first rule and the most useful investment tip one can give you. Therefore, it is crucial to build an investment portfolio consisting of different types of assets.
A portfolio type depends on the investor's goals and risk tolerance and is based on such characteristics as the investment term, the desired return, and the acceptable risk level.
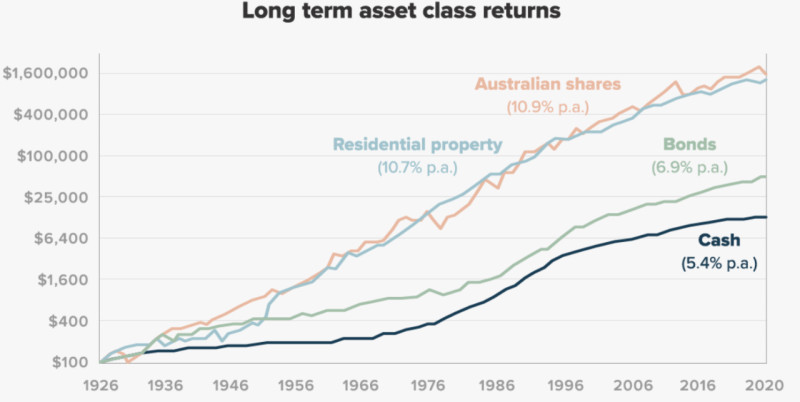
If we talk about high returns, then stocks and bonds are the right option. Stocks are generally considered to have higher return potential while bonds are believed to be more reliable.
Anyway, investors are not recommended to stick with one asset type no matter how profitable or safe it is.
There is an unspoken “bond age” rule which implies that the ratio of bonds in an investor's portfolio should be equal to the investor's age. That is, if an investor is 30 years old, then his/her portfolio should contain 30% in bonds and 70% in other assets.
According to this rule, the ratio of reliable assets, such as bonds, in a portfolio should increase as an investor gets older. However, this rule has been criticized a lot since everyone is unique and requires an individual approach when building a portfolio.
That is why it is important to focus on the goal and the time needed to reach it.
In general, the longer the investment term, the more stocks you can add to your portfolio. And as you get closer to the goal, you can reduce the share of stocks and increase the percentage of bonds and other low-risk assets.
You should keep in mind that stocks are prone to sharp fluctuations. If they make up the biggest part of your portfolio, you can either win big or lose a lot if the market falls.
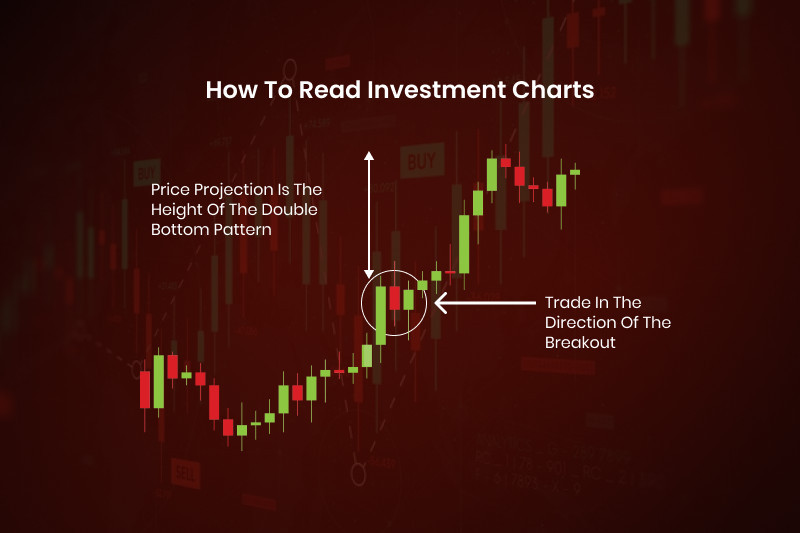
How to read Investment charts
We have already discussed the most profitable types of assets which are stocks and bonds. Let’s learn how to read the charts of these assets to reach your investment goals.
To begin with, let’s take a look at the stock chart and define the current price and the history of quotes. This data can be presented as a table but it won’t be as visual as a chart.
Investors also use charts for technical analysis to predict the future direction of the price based on its previous movements.
What gives investors an advantage over traders is the fact that they have more time to analyze the asset before dealing with it. Oftentimes, traders do not have so much time as they are focused on fluctuations of the price within a day.
What investors have to watch for when analyzing a chart:
- The major trend. Even with the simplest line chart, you can see how the price has been changing over time: it can show steady growth over a long time interval or it can repeatedly rise and fall.
Investors should pay attention to stocks that display a steady uptrend while not being overbought at the same time. If the current price of an asset is considerably higher than its market value, it will tend to reach its real price with time which means it will decline.
The best strategy for an investor will be to find promising companies whose stocks are undervalued, meaning they have high growth potential. These stocks are cheaper than that of market leaders but can bring good returns in the future.
More about stock charts
- Analyze both price changes and trading volumes. The price of shares fluctuates on a daily basis. But when these fluctuations are coupled with changes in the trading volumes, this is something to pay attention to.
For instance, rising volumes usually serve as a confirmation of an uptrend because they indicate that large market players are in. They are the ones who influence prices the most.
When large institutional investors rush to buy or sell an asset, it is a sign for retail investors to follow the lead.
- Moving averages (MA) are one of the most commonly used technical indicators. They can also act as support and resistance levels. MAs are calculated over different periods from 10 to 200 days. The moving averages for a shorter term are more sensitive to price movements.
As a rule, investors use long-term moving averages as they are not looking for small price changes.
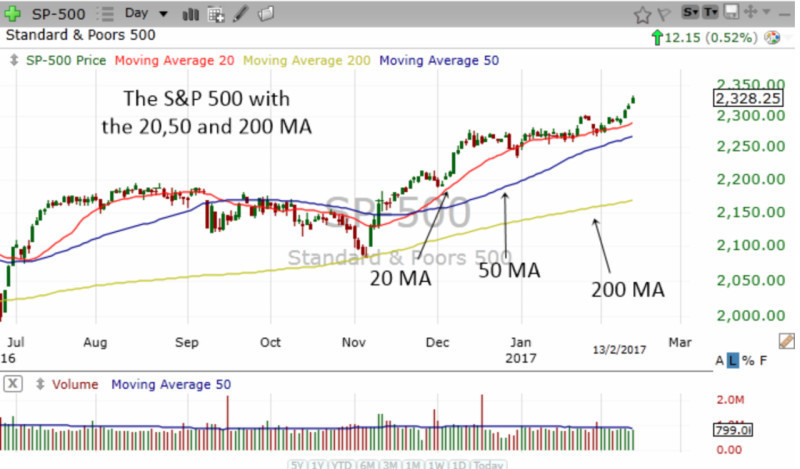
If the price breaks above a moving average, this is a signal to buy an asset, and if it breaks below it, it’s time to sell.
The entry point is where moving averages of different time periods cross (for example, 50-day and 200-day MAs).
The trend is moving upward if the 50-day MA crosses above the 200-day MA. Conversely, if the 50-day MA crosses below the 200-day MA, we are talking about a downtrend.
Cluster charts
As we have found out, trading volumes correlate closely with price fluctuations. Usually, these are two different charts that need to be compared.
However, they can be combined in one chart called a cluster chart. Each element of a chart, or a cluster, consists of a set of data such as trading volumes shown over a certain period of time.
Clustered charts are usually based on Japanese candlesticks that are not just colored red or green but have lines with numbers inside them indicating trading volumes.
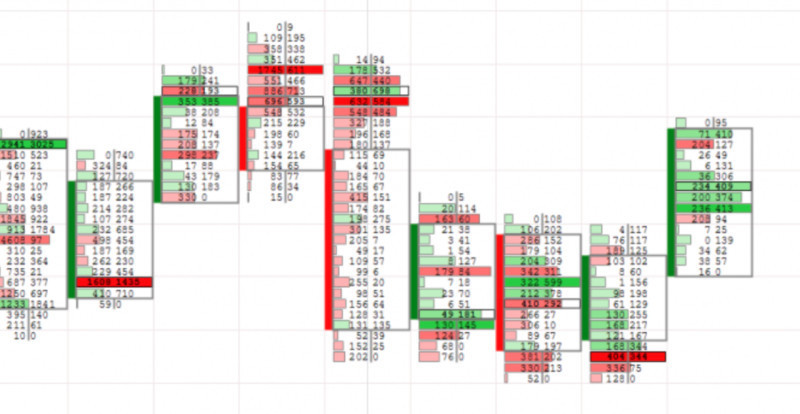
Cluster charts are good for visualizing trades opened by institutional investors and other large market players. The difference with retail investors is obvious.
Apart from trading volumes, cluster charts also provide such data as the delta – the difference between market buy orders and market sell orders.
If the delta is positive, this means that long positions outweigh the short ones. If the delta is negative, the situation is just the opposite. Therefore, if several candlesticks contain a positive delta, the price is set to increase. If they show a negative delta, the price may decline soon.
Cluster charts are not a common function on trading platforms. However, developers created special programs for building this type of chart into your platform.
When to sell an asset
We have covered the topics of buying assets and building investment portfolios. It is also important to know when to get rid of an asset. Let’s discuss this in more detail.
- The income and profit of an issuing company are falling. If the company’s business is getting worse, this may be a signal to sell its shares. This can happen in the case of management reshuffles, changes in the dividend payment policy, or when a stronger competitor appears in the market.
- Revision of the investment strategy. As we have already mentioned above, the share of stocks in a portfolio can prevail over bonds and other assets depending on the investment terms and goals. However, investors may want to change their approach with time and opt for more stable assets. Then they will need to sell some of their stocks.
- Your financial goal has been achieved. When this is done and you have saved enough money for buying real estate, for example, you can sell the assets that you no longer need.
- Diversification. When choosing the right proportion of stocks and bonds in your portfolio, you also need to consider the industry these stocks belong to. Ideally, a portfolio should consist of stocks belonging to different economic sectors. Some sectors, such as electricity or telecommunications, are more stable, while others, such as commodities and transportation, are more volatile.
Conclusion
This article “How to Read Investment Charts” described the types of assets for investment and different charts used for their analysis.
The most commonly used assets are stocks and bonds. However, their share in a portfolio will be different depending on individual goals of an investor and the investment term.
For a long-term investment, the ratio of stocks in a portfolio can be high. As investors get closer to their financial goals, they cut the amount of stocks and opt for less risky assets with lower returns.
Stock charts allow investors to see how the price of an asset has been changing over time and what is the major trend. It is advisable to combine price charts with volume indicators as this helps confirm the trajectory of an asset.
Cluster charts are basically Japanese candlesticks that display trade volumes inside each of the elements. They clearly reflect the current market situation.
You may also like
How to read stock charts
How to read a stock action
How to read graphs
Best indicators for 1 minute chart
How to read a candlesticks chart
Japanese candlestick chart
Candlestick chart


