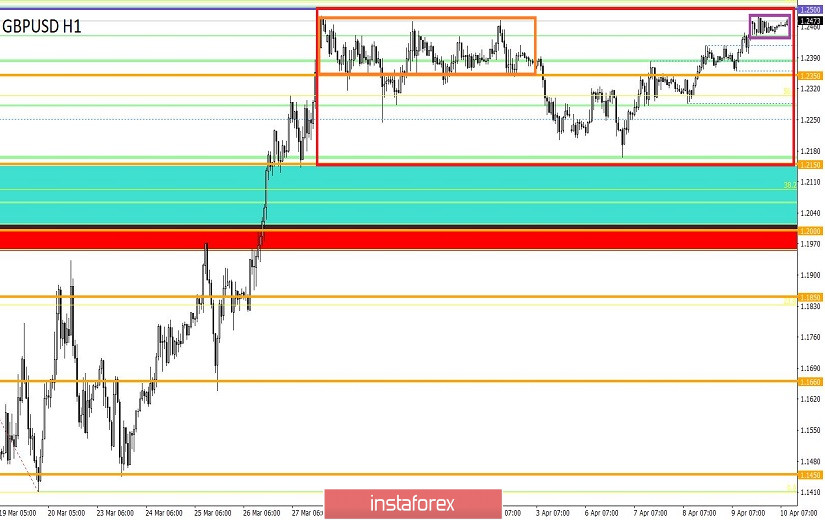
From the point of view of complex analysis, we see a round of long operations that led the quote to where it all began, and now let's talk about the details. A full tact for four trading days suggests that activity is still high, and the wide flat 1.2150 / 1.2480 (1.2500) focuses on itself the special attention of market participants. A detailed examination of tact 1.2150 (1.2166) -> 1.2482 shows that the move was stepwise, that is, the very variable ranges appeared on the path, which was written in the previous review. These steps were a kind of framework for the accumulation of trade forces, due to which it was possible to move within such a wide framework of the flat.
Regarding the structure of the flat and the scale, one can single out the fact that price retention is already in its second week, and this is already a violation of the structure of upward inertia of March 20. That is, the movement following the flat will not be connected with the past inertial move, which means that the scale restriction, and most importantly the direction, does not matter, since a completely new movement in the market awaits us.
Example
Let's imagine that we are considering a breakdown of the upper boundary of the flat, where there is already a significant height from the historical lows, but we have a new turn, and it can literally develop the scale of inertia 09.03.20 - 20.03.20.
Naturally, this is just an example that shows that the subsequent movement can be full-scale, not local.
Regarding the theories of further development, we have already mentioned that the pound can be under further pressure in the medium and long term, where the global downward trend will continue, but external factors [background] will aggravate the already shaky structure.
Analyzing the past trading day, we see that the round of ascending positions appeared during the start of the European session and was held until the beginning of the American session. The subsequent oscillation had a lateral character with variable boundaries of 1.2440/1.2480 (1.2500)
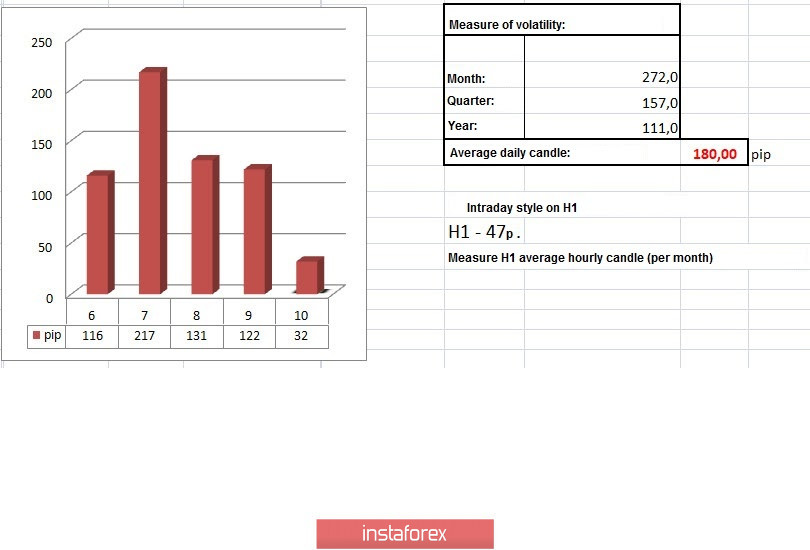
In terms of volatility, we see activity similar in dynamics to last day [April 8], where the slowdown relative to the average daily indicator is 32%. Working with volatility, it can be seen that the dynamics has been declining over the past two weeks, but not so much. Having indicators of 116 - 130 points is considered a considerable level, and this is still an acceleration, on which speculators are actively working.
Details of volatility: Monday - 165 points; Tuesday - 245 points; Wednesday - 172 points; Thursday - 358 points; Friday - 359 points; Monday - 144 points; Tuesday - 271 points; Wednesday - 676 points; Thursday - 354 points; Friday - 522 points; Monday - 267 points; Tuesday - 296 points; Wednesday - 333 points; Thursday - 452 points; Friday - 352 points; Monday - 148 points; Tuesday - 227 points; Wednesday - 108 points; Thursday - 126 points; Friday - 198 points; Monday - 116 points; Tuesday - 217 points; Wednesday - 131 points; Thursday - 122 points. The average daily indicator, relative to the dynamics of volatility is 180 points [see table of volatility at the end of the article].
As discussed in the previous review, traders expected a slowdown relative to the upper boundary of the flat, which eventually happened, but there were no fundamental changes in the form of jumps relative to the frame of 1.2480 (1.2500).
Considering the trading chart in general terms [the daily period], we see a global downward trend, where extreme fluctuations have the form of inertia with scales of more than 1000 points.
The news background of the past day contained data for the UK, where industrial production maintained a decline of -2.8% with a forecast of -2.9%. At the same time, GDP data continued to show a slowdown from 0.7% to 0.3%.
In the afternoon, weekly statistics on applications for unemployment benefits in the United States will be published. Initial applications amounted to 6 606 000, which is 261 000 less than a week earlier, but there were more repeated applications. Their number was 7 455 000, which is considered the maximum in history.
The reaction of the market this time had a positive correlation with fundamental analysis, the US dollar rapidly began to lose its position, but in local consideration again.
In terms of the general informational background, we see that the extremely difficult situation with coronavirus forced the Bank of England to use its overdraft for the first time in 12 years, which will become an additional short-term source of liquidity for the government.
"As a temporary measure, this will give the government a short-term source of additional liquidity in case it is necessary to establish a quiet cash flow and maintain the stable functioning of markets during the period of destabilization caused by the coronavirus pandemic," the regulator said in a statement.
Today, in terms of the economic calendar, we have inflation data in the United States, where a slowdown from 2.3% to 1.5% is recorded, which may directly affect future decisions of the Federal Reserve regarding actions regarding the refinancing rate, which means its future reduction. At the same time, do not forget that today is a holiday in many countries, including the United States and Britain, where they celebrate Good Friday.
The upcoming trading week, in terms of the economic calendar, is not full of statistics, but we have negotiations between the working group of Britain and the EU on Brexit. In turn, the external background will continue to excite speculators and escalate fear on investors.
The most interesting events displayed below --->
Monday, April 13
UK / EU - Bright Monday
Wednesday, April 15
USA 12:30 Universal time - Retail sales
USA 13:15 Universal time - Industrial output
Thursday, April 16
USA 12:30 Universal time - Applications for unemployment benefits
USA 12:30 Universal time - The number of construction permits issued
USA 12:30 Universal time - The volume of construction of new houses
Friday April 17th
USA / EU / Britain - Good Friday
USA 12:30 Universal time - Inflation
Further development
Analyzing the current trading chart, we see exactly the same slowdown that occurred yesterday when the price approached the upper boundary of the main flat. In fact, this accumulation of 1.2440 / 1.2485 is temporary in nature, where a local jump of activity may eventually occur. If we consider the movement relative to the main trend, it does not exclude the occurrence of a new turn of the downward move, just the tact to the lower border of the flat. At the same time, the market is still subject to an external background, which is used by speculators, so trading on the principle of local operations can be relevant.
It can be assumed that the variable range of 1.2440 / 1.2485 will be broken soon, and the movement will not necessarily be the main one, but it will be possible to earn profit on a local surge. Therefore, do not miss the moment and work for the breakdown, with a moderate risk for the position.
Based on the above information, we derive trading recommendations:
- We consider buying positions higher than 1.2500, preferably with a consolidation in the direction of 1.2550 - 1.2620.
- We consider selling positions lower than 1.2435, with the prospect of a movement of 1.2400 - 1.2350.
Indicator analysis
Analyzing a different sector of time frames (TF), we see that the indicators of technical instruments took a buy signal due to the return of the price to the upper boundary of the main flat. At the same time, minute intervals work exclusively on the existing slowdown, the signal is variable.
Volatility per week / Measurement of volatility: Month; Quarter; Year
Measurement of volatility reflects the average daily fluctuation, calculated for Month / Quarter / Year.
(April 10 was built taking into account the time of publication of the article)
The volatility of the current time is 32 points, which is 82% lower than the daily average. It is possible to assume that volatility will increase by 2-3 times as soon as the slowdown framework is broken.
Key levels
Resistance Zones: 1.2500; 1.2620; 1.2725 *; 1.2770 **; 1.2885 *; 1.3000; 1.3170 **; 1.3300 **; 1.3600; 1.3850; 1.4000 ***; 1.4350 **.
Support areas: 1.2350 **; 1.2280 (1.2240); 1.2150 **; 1.2000 *** (1.1957); 1.1850; 1.1660; 1.1450 (1.1411); 1.1300; 1.1000; 1.0800; 1.0500; 1.0000.
* Periodic level
** Range Level
*** Psychological level
**** The article is built on the principle of conducting a transaction, with daily adjustment