


Hardly anyone wants to deal with complex formulas and technical tools. So, the easier the indicator, the more willingly it is used in trading.
In this article, we will take a closer look at the Momentum indicator, a simple and easy-to-use technical tool.
For more information about other indicators, their types as well as pros and cons, read the article "Forex indicators".
What is a Momentum indicator?
The Momentum is a basic analysis tool commonly available on many trading platforms. It is used to determine how quickly the price of an asset changes over a certain period of time.
It is oftentimes attributed to the Oscillator group as it operates as a leading indicator.
That is, using its signals, you can foresee in what direction the price will go further, and trade accordingly.
Averaging is the main component of this tool. It allows the Momentum not to lag.
The indicator is calculated as a percentage based on the current closing price and the price for a selected period of time. So, the difference between the two values is multiplied by 100.
This technical tool shows either the acceleration/deceleration of the trend momentum in the market or the continuation of the current trend.
At the same time, the Momentum can be applied not only when there is a clear trend, but also when the market is flat.
Interestingly, Momentum can be both an oscillator and trend indicator because different time frames are applied to it.
Momentum indicator interpretation
A big advantage of this indicator is that it is easy to use. Even beginner traders can interpret Momentum signals.
The scale of the Momentum ranges between 0 and 100.
One of the simplest ways to use this analytical tool is to determine its position relative to 100.
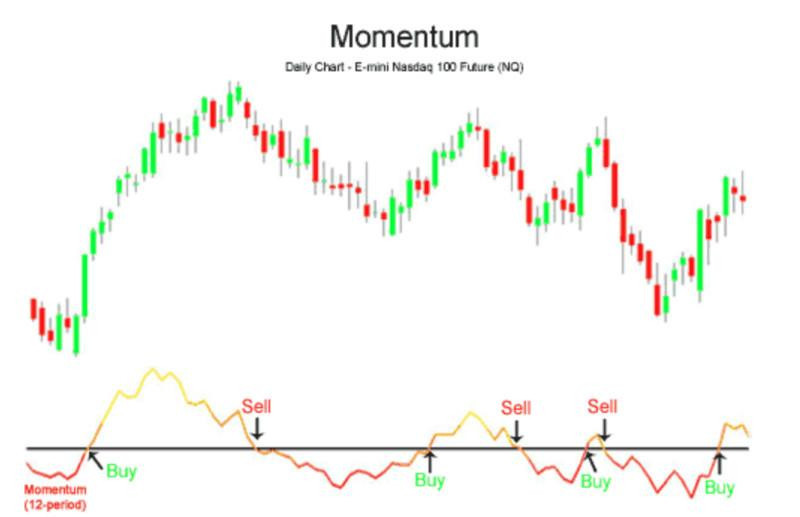
If Momentum continuously rises and goes above the mark of 100, this indicates an uptrend, which is a signal to buy an asset.
If it falls below the mark of 100, this shows a downtrend, which is interpreted as a signal to sell an asset.
When a candlestick on the chart closes above the previous ones, the indicator turns positive.
That is, as long as Momentum shows successive highs, the market is bullish and long positions could be opened.
However, when the indicator shows successive lows, it means that the market is bearish. This is when it is better to sell than to buy an asset.
When a candlestick below the previous ones on the chart closes, the indicator turns negative. In the case of a flat market, the indicator is zero.
These signals are the most effective when the market is in a clear trend.
Still, stronger or sharper price fluctuations also have a negative effect on the Momentum. Thus, it can make false signals during market swings.
Momentum indicator description
The indicator is drawn in a separate window under the price chart.
It looks quite minimalistic as 100 is the only mark added to it. The moment the indicator crosses this level is important for users.
Since it is a leading indicator, its movement may differ from that of the price.
The formula used for calculating this indicator has undergone some changes. Initially, the indicator was calculated as the difference between the current price of an asset and the price for a certain period of time.
For example, if the first element in the formula is period 14, the second element will be the price of an asset 14 candlesticks before the current price.
The indicator calculated according to this formula reflected the price of an asset, which was not convenient for its interpretation.
Therefore, the formula has been reviewed and is now calculated as a percentage.
Right now, the current price of an asset is divided by the previous price (for a given number of periods), and the result is multiplied by 100, with the closing candlestick prices used in all calculations.
All calculations are made automatically when you add and apply the indicator.
This analytical tool is universal and can be used for any trading assets as well as various time frames.
Still, the indicator is proved useless as a way to determine the moment to close a trade.
Momentum indicator settings
Like any other tool, Momentum has standard settings provided by developers. However, some of these settings can be customized.
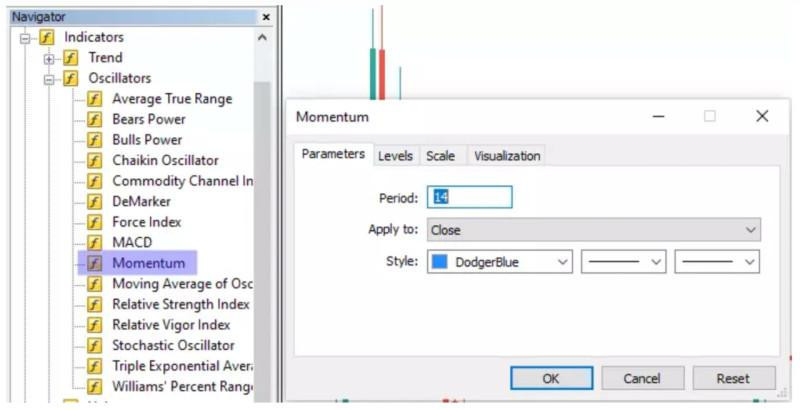
Period 14 is used in the settings of this indicator by default. It is the best period for using Momentum. This means that the current price is being compared to the price of 14 days ago.
Still, the period can be reduced in case of aggressive trading. Consequently, the indicator gets more sensitive and makes more signals.
However, it is important to understand that with a rise in the number of signals, another problem may arise: false signals may be produced more often.
When the period is increased, a smaller number of signals is made, and the indicator becomes less susceptible to price fluctuations. Although there are fewer signals, they are more accurate.
Momentum with a period of more than 20 can also be used for determining the current trend.
When the indicator crosses the mark of 100 and goes above it, it is an uptrend. Conversely, when it falls below this level, it is a downtrend.
The choice of a period depends on a trading asset.
Momentum can be used simultaneously as an oscillator with a standard period and as a trend indicator with a period of more than 20 for one price chart.
Users can also customize certain settings. Thus, they can select the look as well as the color and thickness of the indicator.
Support and resistance are plotted on the chart manually.
Advantages and disadvantages
It may seem that the Momentum has no flaws. Yet, it has some drawbacks. Let’s now look at what are the tool’s pros and cons.
Here are the advantages of the Momentum:
- Visibility. The Momentum can help you determine the direction of the current trend.
- Leading indicator. The tool shows changes in price before they take place on the price chart. This way, traders can yield greater profit from trading.
- User-friendliness. The tool is quite simple. Any user can interpret its signals with ease. Therefore, even newcomers can use it.
- It helps determine oversold and overbought zones on the chart.
- It can show divergences and use them when selling or buying assets.
Here are the indicator’s disadvantages:
- It reacts sharply to price fluctuations. In such cases, the indicator can make many false signals.
- It can’t be used independently. The indicator is not enough to be used in a trading strategy. It should be applied together with other indicators.
- It produces signals for entry only. Therefore, you should look for other ways to close trades.
- When the settings are customized, the indicator can make false signals if a wrong period is selected.
Trading strategy
It is always beneficial for a trader to use a trading strategy. There can be long-term, medium-term, and short-term trading strategies.
The Momentum indicator works best with long-term strategies and can also be used with short-term strategies. At the same time, the tool should not be applied when trading in lower time frames.
The simplest way of using the indicator (when it passes the mark of 100) has already been described above.
When the indicator goes above the mark, it is a signal to buy an asset. Meanwhile, going below 100, the indicator signals to sell an asset.
The difference between Momentum and the price can show divergence on the chart.
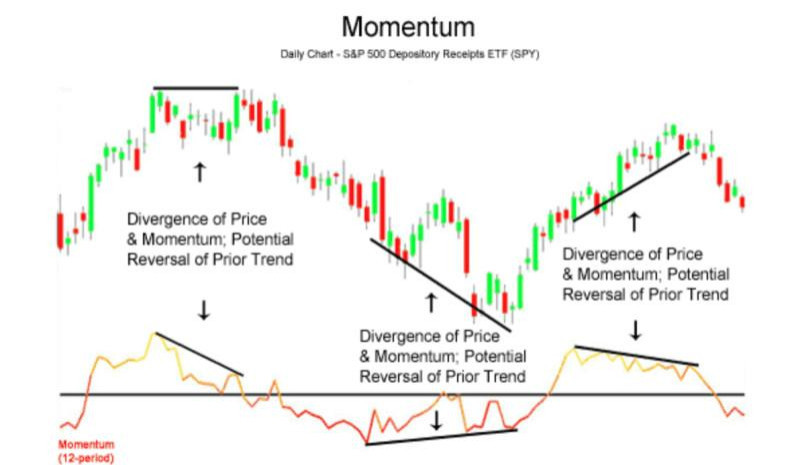
Divergence can occur when there is a new high or low on the price chart but Momentum does not show it.
Divergence also indicates an impending reversal on the chart. In fact, you should use divergence to determine reversals, while other indicators will help you find entry points.
Therefore, when the price hits a new high and Momentum is moving down slightly, there is an impending downward reversal. So, short positions could be opened.
Conversely, when a new low on the price chart is not confirmed by Momentum, the price may soon reverse upward. So, it is a signal to go long.
Automation
You say trading is time-consuming and stressful. We say trading can be calm and take less time.
Owing to modern technologies, market players can now use trading robots – special computer programs – to do the most difficult and time-consuming work.
Thus, they can analyze the market and look for entry points, while you get on with other important tasks.
By and large, trading robots can be allowed to trade. However, professionals still say you should monitor their work and use them only for analysis.
Today, almost any strategy can be automated and almost any analytical tools can be used.
The Momentum is no exception. There are already automated trading strategies based on this tool. At the same time, it is used together with other indicators.
There are several interesting trading algorithms among the automated strategies based on the Momentum. The difference between them is in the indicator, which is used additionally.
Thus, an additional indicator used by expert advisor Momentum Elder is the 19-period exponential moving average (EMA). Meanwhile, the period for Momentum is 18.
According to this algorithm, Momentum must be above 100, and the price should cross the EMA upward in order to open a trade.
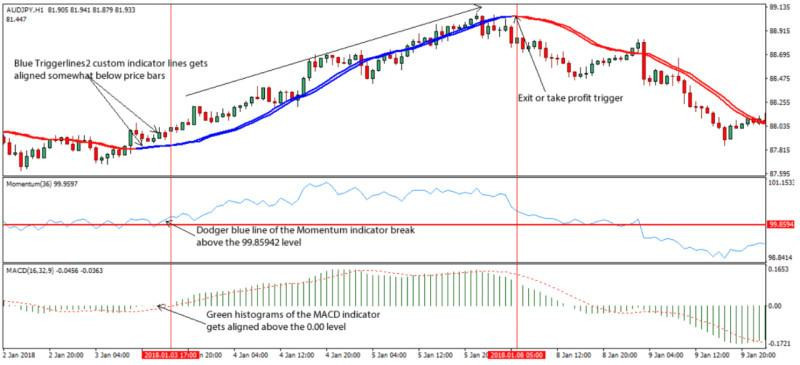
Another expert advisor - MACD Momentum - uses the MACD as an additional indicator. This robot is used for trading currency pairs, of which one is the Japanese yen.
Here a trade can be opened after the Momentum confirms the signal made by the MACD.
How to use
There is a set of rules every trader using the Momentum should follow if they want to trade efficiently. Here is this list:
1. Momentum – is a user-friendly leading indicator. Only a few technical tools have the same feature.
2. Do not worry if the indicator goes in the opposite direction from the price. This way it shows that the price has not changed yet.
3. The Momentum indicator can be used for trading with or against the trend depending on the state of the market.
4. Using Momentum is quite simple when trading with the trend: you can open a buy or sell trade when the indicator goes above or below 100 respectively.
5. Remember that the indicator operates smoothly when its settings are configured correctly. You should select the optimal period depending on the asset and the time frame.
6. Standard periods for this tool are intervals from 10 to 14. Yet, you can choose other periods if needed.
7. So, by reducing the period to 5, for example, the indicator gets more sensitive and makes more signals than when it has default settings. However, many of such signals may turn out to be false, so you need to use additional indicators to confirm them.
8. If you set a period of more than 20, Momentum will act as a trend indicator. It will look smoother although its signals will be weaker but more accurate.
9. Overbought and oversold zones can be plotted on the Momentum chart only manually. These levels are added in settings.
10. When Momentum leaves the overbought zone, you can go short, and when it leaves the oversold zone, you can go long.
11. This strategy should only be followed when the market is flat. This algorithm does not work when there are market swings, and you are more likely to incur losses.
12. The MAs and the MACD can be used as additional tools to confirm signals made by the Momentum. They operate well together and produce good trading results.
13. In addition, strategies based on the combination of these tools can be automated and used for trading with the help of expert advisors.
14. Other indicators should be applied to determine the closing levels because Momentum is not intended for this.
15. Divergence can be found when there is a difference between the price and Momentum. It indicates an imminent trend reversal.
Final thoughts
In this article, we have discussed the basic features of the Momentum indicator and outlined its advantages and disadvantages as well as ways to use it with various trading strategies.
Momentum is a user-friendly and efficient indicator. In addition, it is one of the leading indicators.
The easiest way to use this tool is to look for buy and sell signals from the indicator when it passes the mark of 100. Thus, when it goes above the barrier, it is a signal to buy an asset. Meanwhile, when it goes below the level, it is a signal to sell.
At the same time, it operates efficiently when customized properly. Setting the right period is the most important thing here.
When setting a shorter period, Momentum will start making more signals but most of them are likely to be false.
When a lengthier period is set, the tool will produce fewer signals. Yet, they will be more accurate.
Momentum can be used as a trend indicator with a period of more than 20.
Likewise, it can be used as an oscillator with a standard period (10 or 14) and as a trend indicator with a period of more than 20 at the same time.
Still, other indicators should be used to confirm and filter signals made by Momentum.
In trading systems, including automated ones, it is used in combination with other tools.
Read more
Bollinger Bands: strategy and way of use
MFI Indicator (Money Flow Index): complete guide
Awesome Oscillator: how to use
Support and Resistance Indicator MT4, MT5
VWAP Indicator (Volume Weighted Average Price)
MT4 indicators: how to install and use
Candlestick patterns Indicator for MT4, MT5
Forex volume indicators for MT4, MT5
Forex arrow indicators for MT4


