From the point of view of complex analysis, we see a movement contrary to the fundamental approach, where the quote eventually reached the level of 1.0775. Now, let's talk about the details. Last week, in terms of a downward movement, the quote managed to pass more than 350 points, not paying attention to all the constraining factors. As a result, we received an inertia again in a downward course, and the sequence of them, which has stretched right from the beginning of the year, is still preserved.
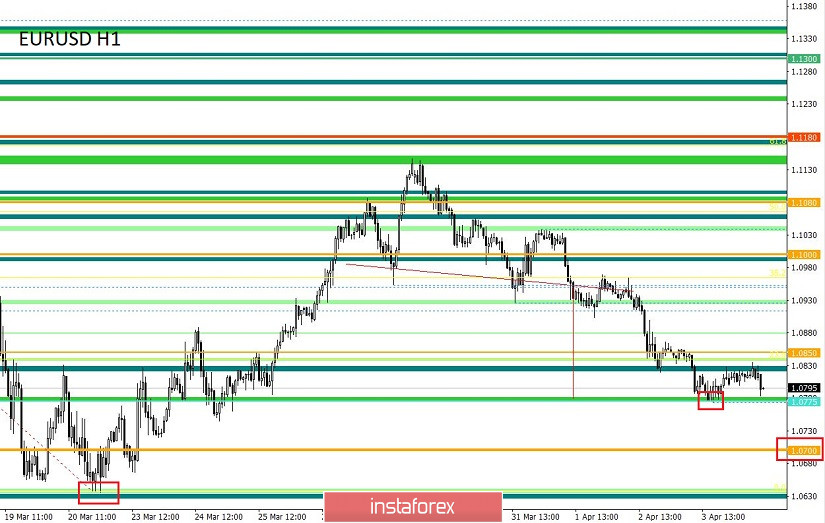
Concerning the graphic model "Head and shoulders" [H1 graph], which we managed to identify on April 1, there was a 100% implementation to everyone's surprise. The figure did not just have even forms, it also developed a profit segment. The end of which coincided with a variable level of 1.0775.
Regarding trading approaches, tactics have remained unchanged and carry local operations. On the other hand, regarding the theory of inertial oscillations, it was noted that with each successive descending course, the minimum of early inertia was overcome. Based on this logic, a minimum of 1.0636 may be at risk of breakdown in the near future, and if you look at the current location of the quote, then the chance is extremely high.
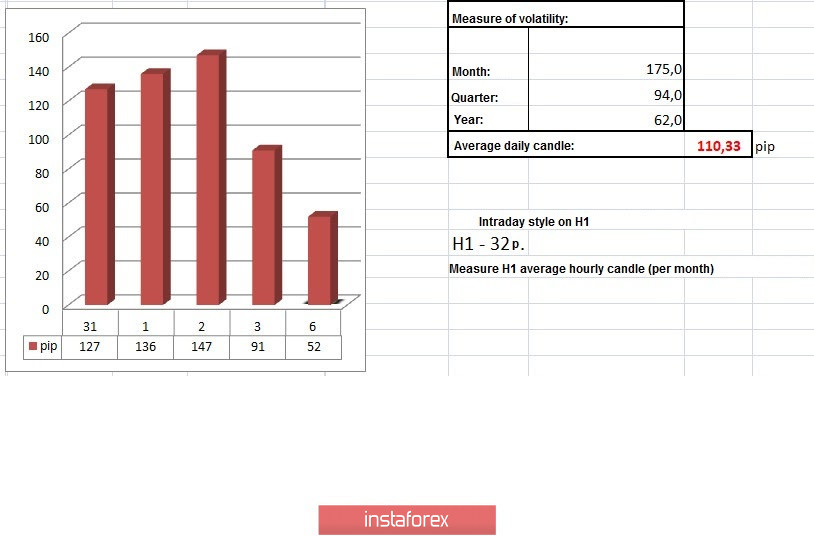
In terms of volatility, we see the first slowdown in volatility relative to the daily average for several months. 91 points seems to be not so much now, but just at the beginning of March, the average daily figure was 50 points, and now we understand how much we have dispersed the activity. I do not think it is necessary to say that the process of slowing down volatility has come, since there is still a long way to go to the norm of activity of the single currency, and the external background is still large.
Details of volatility: Monday - 155 points; Tuesday - 183 points; Wednesday - 115 points; Thursday - 278 points; Friday - 166 points; Monday - 151 points; Tuesday - 234 points; Wednesday - 243 points; Thursday - 326 points; Friday - 194 points; Monday - 191 points; Tuesday - 160 points; Wednesday - 133 points; Thursday - 188 points; Friday - 194 points; Monday - 134 points; Tuesday - 127 points; Wednesday - 136 points; Thursday - 147 points; Friday - 91 pips The average daily indicator, relative to the dynamics of volatility is 110 points [see table of volatility at the end of the article].
Parsing Friday, we see that downward interest has been present literally since the opening of the daily candle, but the main round of short positions arose at the start of the European session. The subsequent movement was in the direction of the level of 1.0775, where after a control touch the quote moved to a slowdown.
As discussed in the previous review, traders were already taking short positions, where the main profit was already taken, and the level of 1.0775 was suitable for partial and full profit taking. The further move was considered in two versions: the first is a continuation of the downward move, but in this case, a clear price fixing was needed below the level of 1.0775, but this did not happen; the second option considered a rebound from the level of 1.0775, which turned out to be attractive in terms of local operations.
Considering the trading chart in general terms [the daily period], we see all the same inertial fluctuations in the structure of the global downward trend.
Friday's news background was extremely broad and negative, starting with Europe, where the final data on the business services index were published, recording a decrease from 52.6 to 26.4. The mainstream news awaited us in the afternoon, where the report of the United States Department of Labor was published. They didn't expect anything good from it, the number of jobs should have decreased by 150 thousand, but it wasn't there, the decrease was already by 701 thousand. Of course, these are terrifying indicators and one of the fastest downward accelerations, but why be surprised when we see millions of applications for unemployment benefits in the states. In turn, the unemployment rate shows strong growth from 3.5% to 4.4% with a forecast of growth to 4.0%.
Now, the most surprising thing is that the market reaction to such negative statistics was in favor of a stronger dollar. In the current period of time, the fundamental analysis has literally ceased to function, and the panic mood, against the background of the COVID-19 virus, is literally the reason for everything. Investors perfectly see the situation in the world and everywhere fix global problems. If the United States has such problems with the labor market, then what can we expect from Europe or from other regions? The consequences of coronavirus can be overwhelming, and amid the current background, it is better to sit in a situation where the risk is conditionally less, that is, not to jump from one risky asset to another since the risk may be even greater.
Today, in terms of the economic calendar, we do not have statistics worth paying attention to, and market participants will continue to monitor the external background and the possible consequences of coronavirus on the global economy.
Further development
Analyzing the current trading chart, we see that the quote continues to focus on the downward trend after a small pullback, where the base point in the form of the level of 1.0775 is still maintained on the market. In fact, there is a chance of a possible downward development again, where the focus is not on the level of 1.0775, but the local minimum of 1.0636. That is, we continue to focus on the theory of updating minimum in the course of successive inertia.
In terms of emotional background, we see a persistent panic, due to which there is activity and local denial of the principles of analysis of TA and FA.
It can be assumed that downward interest will be most relevant after fixing the price lower than 1.0775. In the case of a developing one, it is possible to consider a sequential move in the form of steps 1.0700-1.0650 (1.0636).
Based on the above information, we derive trading recommendations:
- We consider buying positions in case of deceleration relative to the fluctuating 1.0775 / 1.0835 and fixing the price higher than 1.850.
- We consider selling positions already in the field of price fixing lower than 1.0775, with the prospect of a movement to 1.0700-1.0650.
Indicator analysis
Analyzing a different sector of time frames (TF), we see that the indicators of technical instruments occupy a single signal about the sale due to the downward inertia.
Volatility per week / Measurement of volatility: Month; Quarter; Year
Measurement of volatility reflects the average daily fluctuation calculated from Month / Quarter / Year.
(April 6 was built taking into account the time of publication of the article)
The volatility of the current time is 52 points, which is half lower than the daily average. It can be assumed that in the case of the passage of the level of 1.0775, the acceleration of volatility can go to the stage of reaching an average indicator with a further increase during inertia.
Key levels
Resistance zones: 1.0850 **; 1,1000 ***; 1.1080 **; 1,1180; 1.1300; 1.1440; 1.1550; 1.1650 *; 1.1720 **; 1.1850 **; 1,2100
Support Areas: 1.0775 *; 1.0650 (1.0636); 1,0500 ***; 1.0350 **; 1,0000 ***.
* Periodic level
** Range Level
*** Psychological level