When to open long positions on EUR/USD:
In my morning article, I turned your attention to 1.0889 and recommended making decisions with this level in focus. Now, let's look at the 5-minute chart and figure out what actually happened. A breakout and an upward retest of 1.0720 led to a sell signal for the euro. It is still relevant at the time of writing the article. Until the trading is carried out below 1.0720, a bearish trend will prevail. For the second half of the day, the technical outlook remained the same.
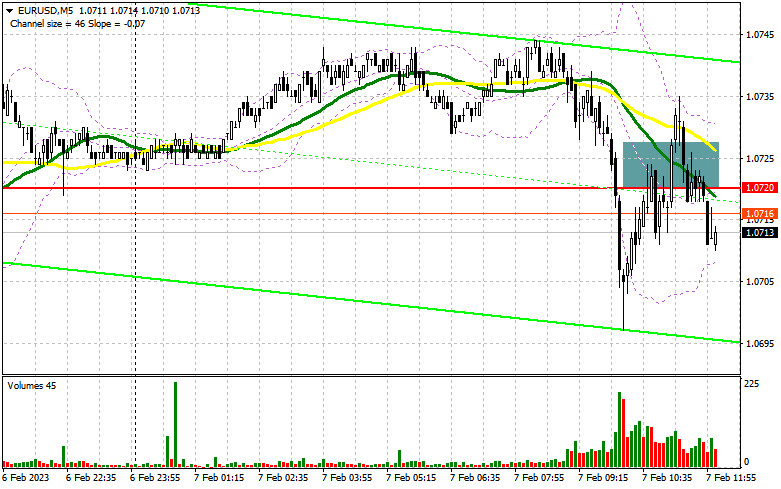
During the American session, the main trend is likely to be intact as there are no events that could affect it. The bulls have already pushed the pair to 1.0700. However, it failed to resume a steady increase from this level. Reports on US trade balance and consumer lending are unlikely to weaken the US dollar against the euro. However, speculators are looking forward to Jerome Powell's speech. He is expected to provide new clues on the Fed's plans for monetary policy, especially after NFP data released last Friday. If his remarks are hawkish, it could lead to an even bigger decline in EUR / USD. In this light, I advise you not to rush with purchases. If the pair dips, only a false breakout of 1.0687 will give a buy signal with the aim of breaking through the resistance level of 1.0720, which acted as support in the morning. Its test will provide a new buying opportunity with the likelihood of a jump to 1.0764 where the moving averages are benefiting bears. A breakout of this level will also force the bears to close their Stop Loss orders and give a new buy signal with the possibility of an increase to 1.0795 where I recommend locking in profits. If EUR/USD declines and buyers show no activity at 1.0687 or if there is no strong rise from this level after Jerome Powell's speech, it is better to postpone long positions until a false breakout of the support level of 1.0653. It will generate a new buy signal. You could open long positions at a bounce from the low of 1.0618 or 1.0569, keeping in mind an upward intraday correction of 30-35 pips.
When to open short positions on EUR/USD:
Bears are still in control although they are not as strong as they were a few days ago. Given that there are no crucial macro stats and the likelihood of an upward correction is high, everything will depend on Powell's remarks on the labor market. For this reason, I expect large sellers to enter the market at 1.0720. As long as trading is carried out lower, short positions are relevant. A false breakout of this level will give another sell signal and a chance for the bears to reach a new weekly low of 1.0687. Its breakout and an upward retest, similar to the one I have mentioned above, will generate a sell signal with a decrease to a low of 1.0653. Consolidation below this level, which, may occur only amid strong US data, will trigger a stepper correction to 1.0618 where I recommend locking in profits. If EUR/USD climbs during the American session and bears show no energy at 1.0720, equilibrium will prevail in the market. It means that there will be no clear-cut trend. In this case, it is better to open long positions at a high of 1.0764. A false breakout of this level will give an excellent entry point. If the pair does fall from 1.0764, you could sell EUR/USD only from the new resistance level of 1.0795, keeping in mind a downward intraday correction of 30-35 pips.
COT report
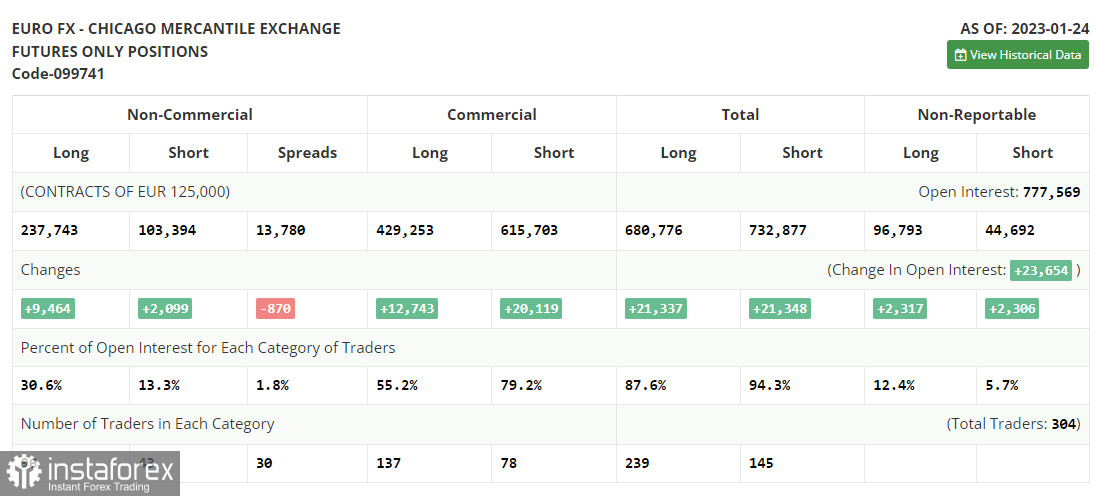
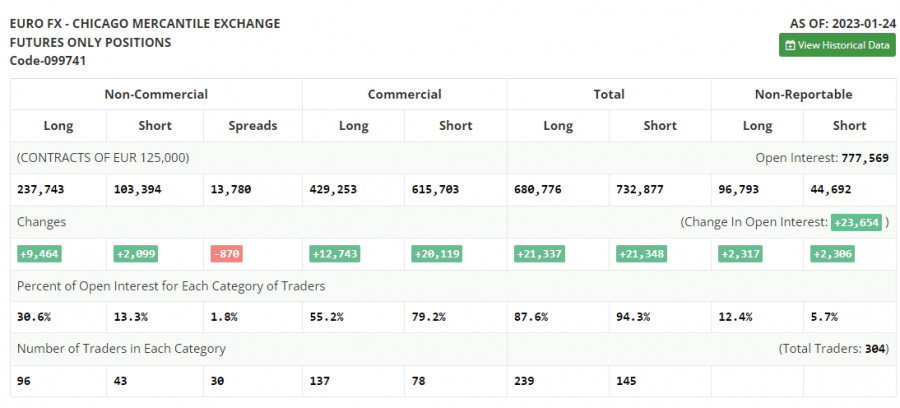
The COT report for January 24 logged a rise in both short and long positions. Traders have significantly increased long positions following hawkish speeches of ECB policymakers. They are betting on further monetary tightening by the ECB and the Fed's dovish stance. The US regulator may reduce the pace of tightening for the second time in a row. Weak macro stats on the US economy, namely a drop in retail sales and a slowdown in inflation may force the central bank to take a pause in rate hikes to avoid any damage. This week, several central banks will hold their meetings. Their results will eventually determine the trajectory of the euro/dollar pair. According to the COT report, long positions of the non-commercial group of traders increased by 9,464 to 237,743 while short positions advanced by 2,099 to 103,394. At the end of the week, the total non-commercial net position rose to 134,349 from 126,984. It appears investors believe in the upside potential of the euro. Nevertheless, they are waiting for more clues from central banks regarding interest rates. The weekly closing price grew to 1.0919 from 1.0833.
Indicators' signals:
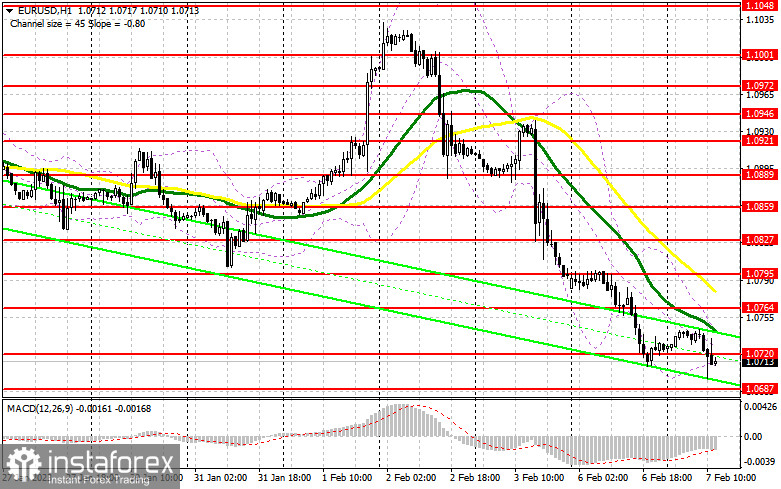
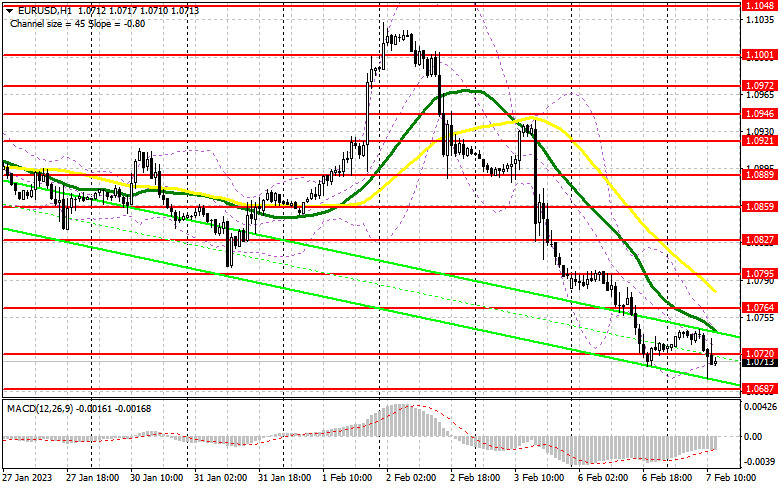
Trading is carried out below the 30 and 50 daily moving averages, which indicates a bear market.
Moving averages
Note: The period and prices of moving averages are considered by the author on the H1 (1-hour) chart and differ from the general definition of the classic daily moving averages on the daily D1 chart.
Bollinger Bands
If EUR/USD rises, the indicator's upper border at 1.0740 will serve as resistance. In case of a decline, the indicator's lower border at 1.0720 will act as support.
Description of indicators
- Moving average (moving average, determines the current trend by smoothing out volatility and noise). Period 50. It is marked yellow on the chart.
- Moving average (moving average, determines the current trend by smoothing out volatility and noise). Period 30. It is marked green on the chart.
- MACD indicator (Moving Average Convergence/Divergence - convergence/divergence of moving averages) Quick EMA period 12. Slow EMA period to 26. SMA period 9
- Bollinger Bands (Bollinger Bands). Period 20
- Non-commercial speculative traders, such as individual traders, hedge funds, and large institutions that use the futures market for speculative purposes and meet certain requirements.
- Long non-commercial positions represent the total long open position of non-commercial traders.
- Short non-commercial positions represent the total short open position of non-commercial traders.
- Total non-commercial net position is the difference between the short and long positions of non-commercial traders.