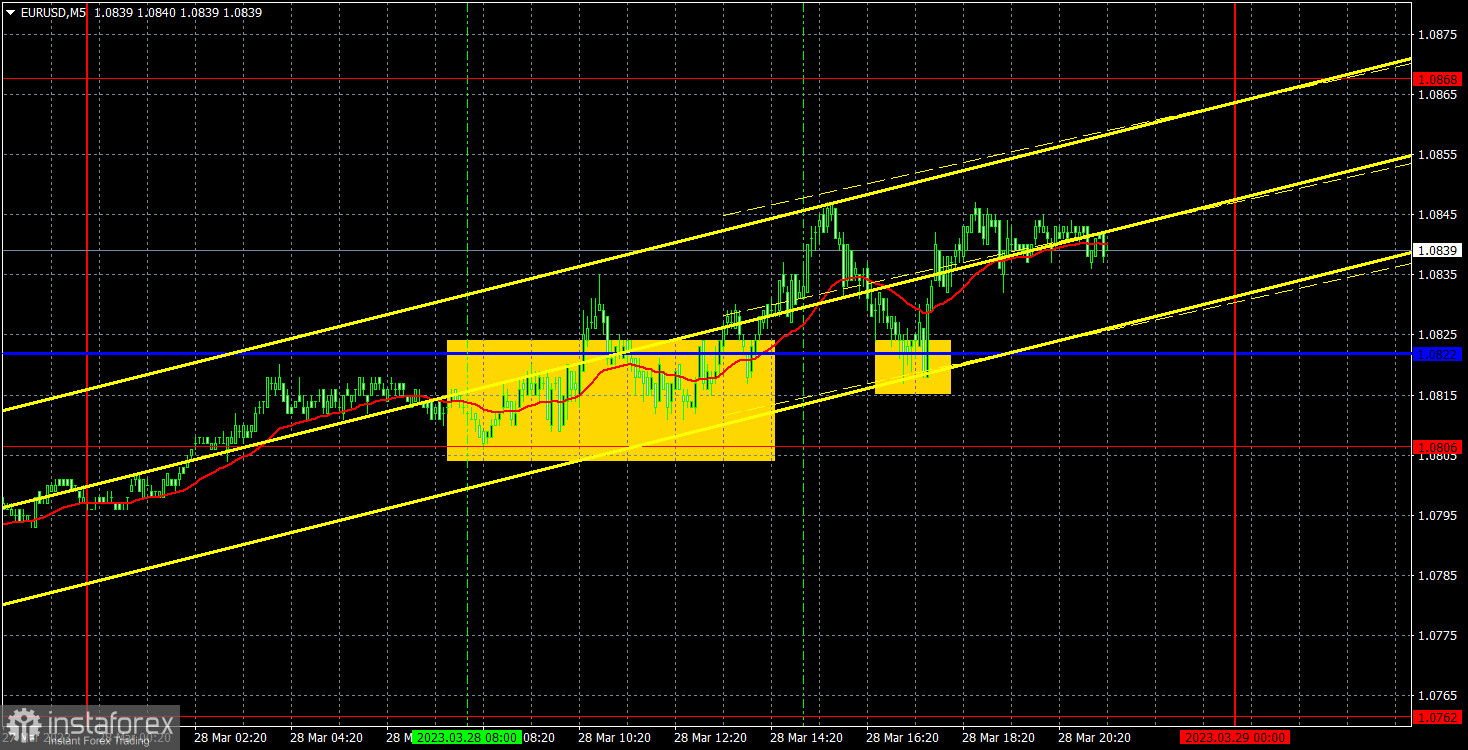
5M chart of EUR/USD
On Tuesday, EUR/USD stretched its upward movement. Not too strong, volatility was weak, and the pair was constantly correcting within the day, which makes it difficult to trade. There were no important events in the US or the EU, so there was nothing for traders to react to. It is more surprising to see the euro rise for the second straight day, which had managed to grow considerably before that. I still believe that for the last couple of weeks and in the last half of the year, the euro's growth is not quite justified and that the correction should stretch out even more. However, recently, we have discovered some reasons for the euro to rise. They are not exactly strong, but the market may think so. Therefore, there's a good reason why the euro is rising after all.
Speaking of trading signals, everything was just as difficult. The pair spent the entire European session between 1.0806 and the critical line, and the pair only managed to climb above it during the US session. A bit later, the pair rebounded from this area, forming another buy signal. Both in the first and second cases, the price traveled 15 pips in the right direction, so you could take the Stop Loss on Breakeven. It was all that traders could count on for both the first and second case. Therefore, there was no loss on any trade.
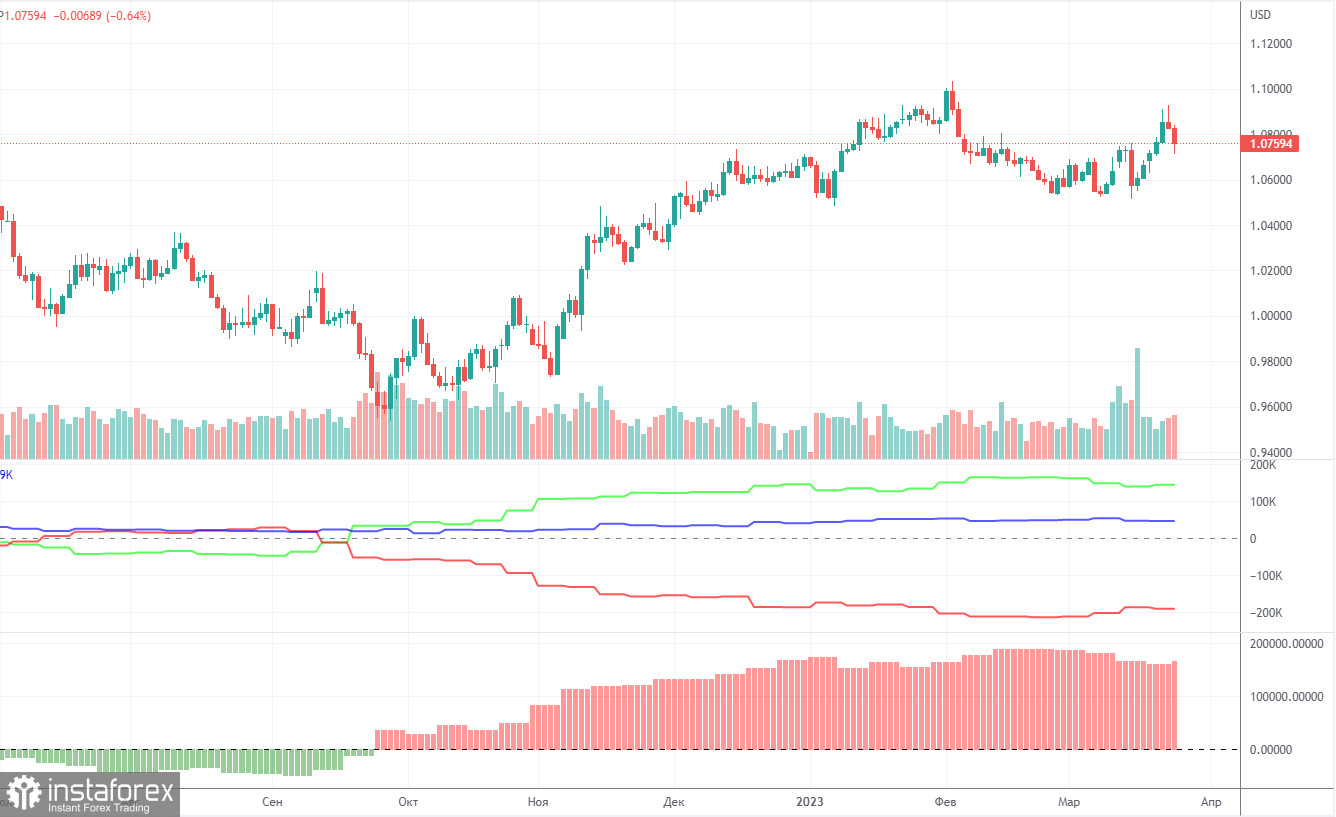
COT report:
On Friday, the new COT report for March 21 was released. The Commodity Futures Trading Commission has caught up with the lost time and has now released reports exactly on time. In the last few months, the picture was completely consistent with what was happening in the market. On the chart above, we see that the net non-commercial position of large traders (second indicator) has risen since September 2022. At about the same time, the euro started to rise. The net non-commercial position is bullish and only started to fall during the last couple of weeks, which coincides with the euro's decline. I have already drawn your attention to the fact that a fairly high value of the "net position" allows us to expect the uptrend to stop shortly. Such a signal comes from the first indicator, with the green line and the red line being far apart, which is usually a sign of the end of a trend. The euro has already started to fall, but we don't know if it's just a bearish correction or a new downtrend. According to the latest report, non-commercial traders closed 6,500 long positions, while the number of short ones decreased by 11,300. Consequently, the net position rose by 4,800. The number of long positions exceeds that of short ones by 145,000. In any case, a correction has been looming for a long time. Therefore, even without reports, it is clear that the downtrend will continue.
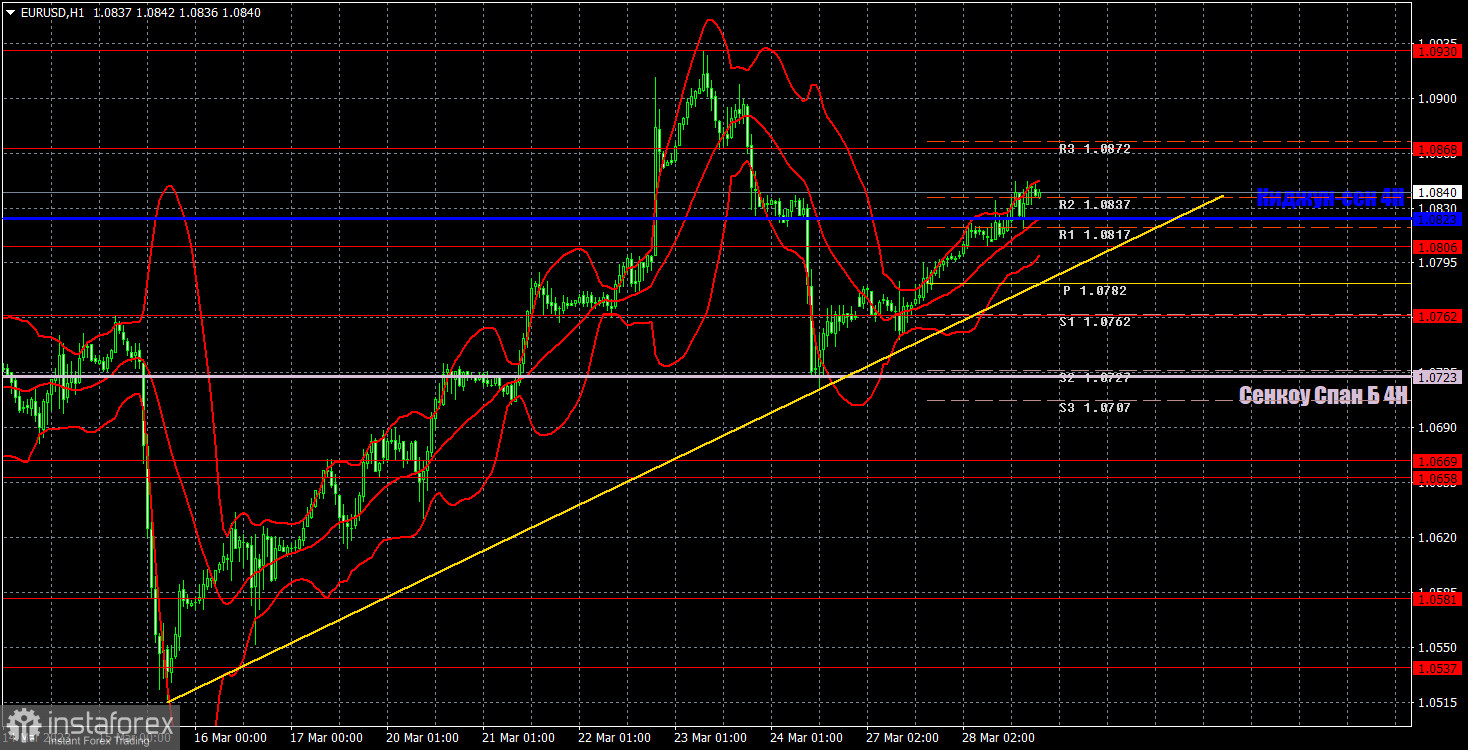
1H chart of EUR/USD
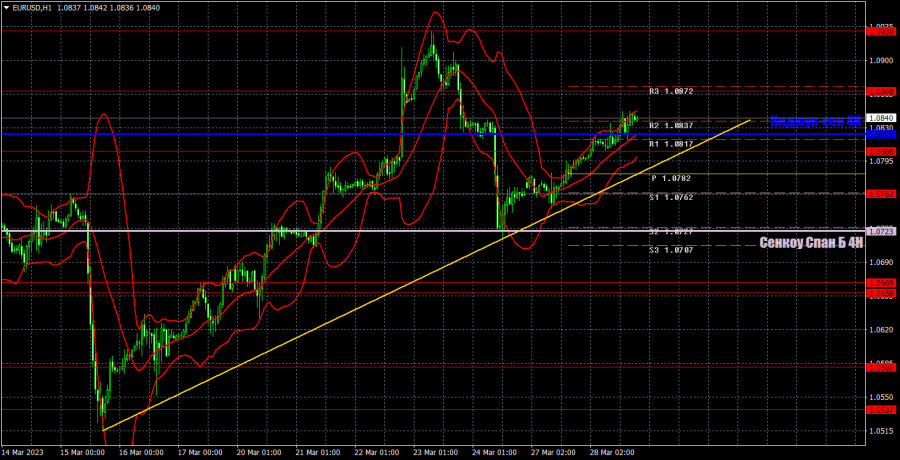
On the one-hour chart, EUR/USD had been rising for six straight days, entered a correction, but is now heading upwards again. So we had to rebuild the uptrend line. The price managed to overcome the Kijun-Sen line on Tuesday, so now we have a higher chance of continuing the upward movement. The pound's case isn't exactly clear, but in the euro's case, the single currency might eventually settle below the trend line and fall further. On Wednesday, important levels are seen at 1.0537, 1.0581, 1.0658-1.0669, 1.0762, 1.0806, 1.0868, 1.0938, 1.1033, 1.1137-1.1185 as well as the Senkou Span B (1.0723) and Kijun Sen (1.0823) lines. Ichimoku indicator lines can move intraday, which should be taken into account when determining trading signals. There are also support and resistance although no signals are made near these levels. They could be made when the price either breaks or rebounds from these extreme levels. Do not forget to place Stop Loss at the breakeven point when the price goes by 15 pips in the right direction. In case of a false breakout, it could save you from possible losses. There are no important events or reports scheduled for March 29 in the European Union and the United States. There will be nothing to react during the day, so it is likely that we will have another weak movement, which will be very difficult to work out.
Indicators on charts:
Resistance/support - thick red lines, near which the trend may stop. They do not make trading signals.
Kijun-sen and Senkou Span B are the Ichimoku indicator lines moved to the hourly timeframe from the 4-hour timeframe. They are also strong lines.
Extreme levels are thin red lines, from which the price used to bounce earlier. They can produce trading signals.
Yellow lines are trend lines, trend channels, and any other technical patterns.
Indicator 1 on the COT chart is the size of the net position of each trader category.
Indicator 2 on the COT chart is the size of the net position for the Non-commercial group of traders.