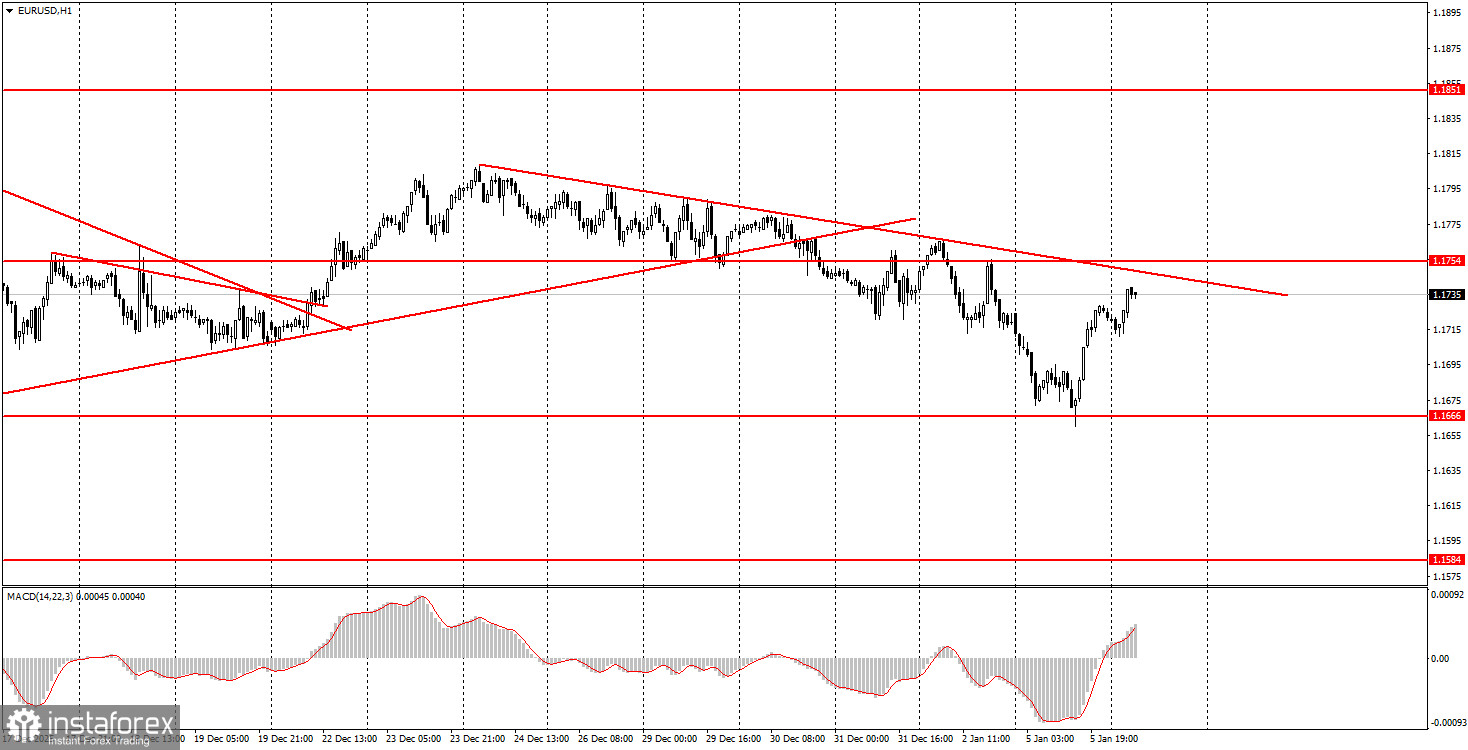
Review of Monday's Trades:EUR/USD 1H Chart
On Monday, the EUR/USD currency pair managed to trade in both directions. During the night and throughout the day, the pair actively declined under pressure from the arrest of Venezuelan President Nicolas Maduro. An unsafe "safe-haven currency"—that is how the dollar can be described now. By old habit, the market began buying the dollar yesterday amid geopolitical tension in Venezuela, but very quickly remembered that one of the parties to the conflict is actually the United States itself. And it is hard to call Trump's political course stable. Thus, the dollar cannot be considered a "safe haven" at present.
Traders also very quickly recalled that the macroeconomic background remains a key factor for the dollar in January, since the Federal Reserve's decision at the end of the month will depend on it. Yesterday, the first significant report of the week was released—the ISM Manufacturing PMI. The report failed, and the dollar immediately collapsed. And this is only the beginning of an important week for the US currency. On the hourly timeframe, a new downward trend remains in place, which may end as early as today or Wednesday.
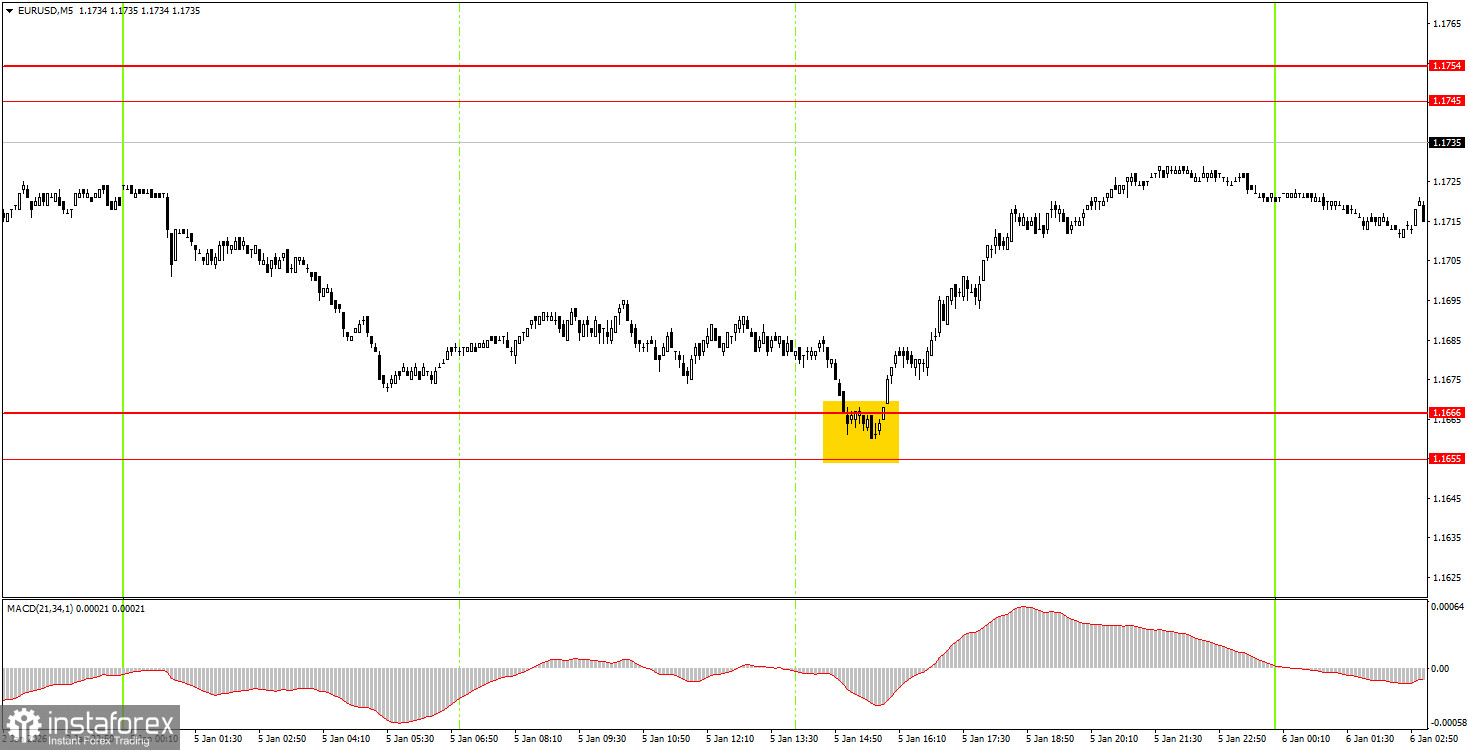
EUR/USD 5M Chart
In the 5-minute timeframe, one trading signal was formed on Monday. At the beginning of the US trading session, just before the release of the ISM index, the pair tested the 1.1655–1.1666 level and bounced off it. Thus, beginner traders could open long positions based on a fairly clear and precise signal. The trade could have been closed yesterday evening with a decent profit, or left open in anticipation of a move toward the 1.1745–1.1755 level.
How to Trade on Tuesday
On the hourly timeframe, the trend has indeed shifted to bearish, but most likely not for long. The pair failed to break through the 1.1800–1.1830 level, which represents the upper boundary of the flat on the daily timeframe. Therefore, from a technical perspective, the decline is natural and may continue all the way to the 1.1400 level. However, the overall fundamental and macroeconomic background remains very weak for the US dollar, so we expect the pair to rise in the medium term.
On Tuesday, beginner traders may trade from the 1.1745–1.1755 level. A rebound from this zone would allow opening short positions with a target at 1.1655–1.1666. A firm consolidation above this area would allow trading to the upside with a target at 1.1808.
On the 5-minute timeframe, the following levels should be considered: 1.1354–1.1363, 1.1413, 1.1455–1.1474, 1.1527–1.1531, 1.1550, 1.1584–1.1591, 1.1655–1.1666, 1.1745–1.1754, 1.1808, 1.1851, 1.1908, 1.1970–1.1988.
On Tuesday, several macroeconomic releases are scheduled in the EU and the US, but only the inflation report from Germany is of any real interest. All other reports are secondary.
Basic Rules of the Trading System
- The strength of a signal is determined by the time it took to form (a bounce or a breakout). The less time it takes, the stronger the signal.
- If two or more trades were opened near a level based on false signals, all subsequent signals from that level should be ignored.
- In a flat market, any pair may generate many false signals—or none at all. In any case, at the first signs of a flat, it is better to stop trading.
- Trades are opened during the time period from the start of the European session until the middle of the US session, after which all trades should be closed manually.
- On the hourly timeframe, signals from the MACD indicator should preferably be traded only when there is good volatility and a trend confirmed by a trend line or trend channel.
- If two levels are located too close to each other (5 to 20 points apart), they should be considered as a support or resistance zone.
- After the price moves 15 points in the correct direction, the Stop Loss should be moved to breakeven.
What Is Shown on the Charts
- Price support and resistance levels are the levels that serve as targets when opening buy or sell positions. Take Profit levels can be placed near them.
- Red lines are channels or trend lines that show the current trend and indicate the preferred trading direction.
- The MACD indicator (14,22,3)—histogram and signal line—is an auxiliary indicator that can also be used as a source of signals.
Important speeches and reports (always listed in the economic calendar) can strongly affect the movement of a currency pair. Therefore, during their release, trading should be carried out with extreme caution, or traders should exit the market to avoid sharp reversals against the preceding move.
Beginner forex traders should remember that not every trade can be profitable. Developing a clear strategy and practicing proper money management are the keys to long-term success in trading.